Loading Search...

Reading crypto charts is all about interpreting price action. Find the easiest way to start your journey as a top technicaly analyst by learnnig how to read crypto charts
Author: Chirag Sharma
Many beginners feel overwhelmed by crypto charts, but reading them is easier than it seems. Understanding charts is a fundamental skill for traders, offering valuable insights into price movements, trends, and potential market opportunities. By mastering the basics, you’ll be able to make more informed decisions in your trading journey. So, how to read crypto charts? It’s all about interpreting price action. Crypto charts visually represent price data over time, using candlesticks, patterns, and indicators to display what’s happening in the market. These tools allow traders to assess whether the price of an asset is likely to rise or fall.
Charts primarily track price movements over different timeframes—ranging from minutes to months. By understanding the components of these charts—such as candlesticks, trends, and volume—you can start to identify patterns that often repeat themselves, offering clues about future price movements.
This article will break down the essentials, starting with the building blocks of chart analysis, like candlesticks, and moving into more complex topics like identifying trends and chart patterns. By the end, you’ll know how to read crypto charts with confidence and apply that knowledge to your trading strategy.

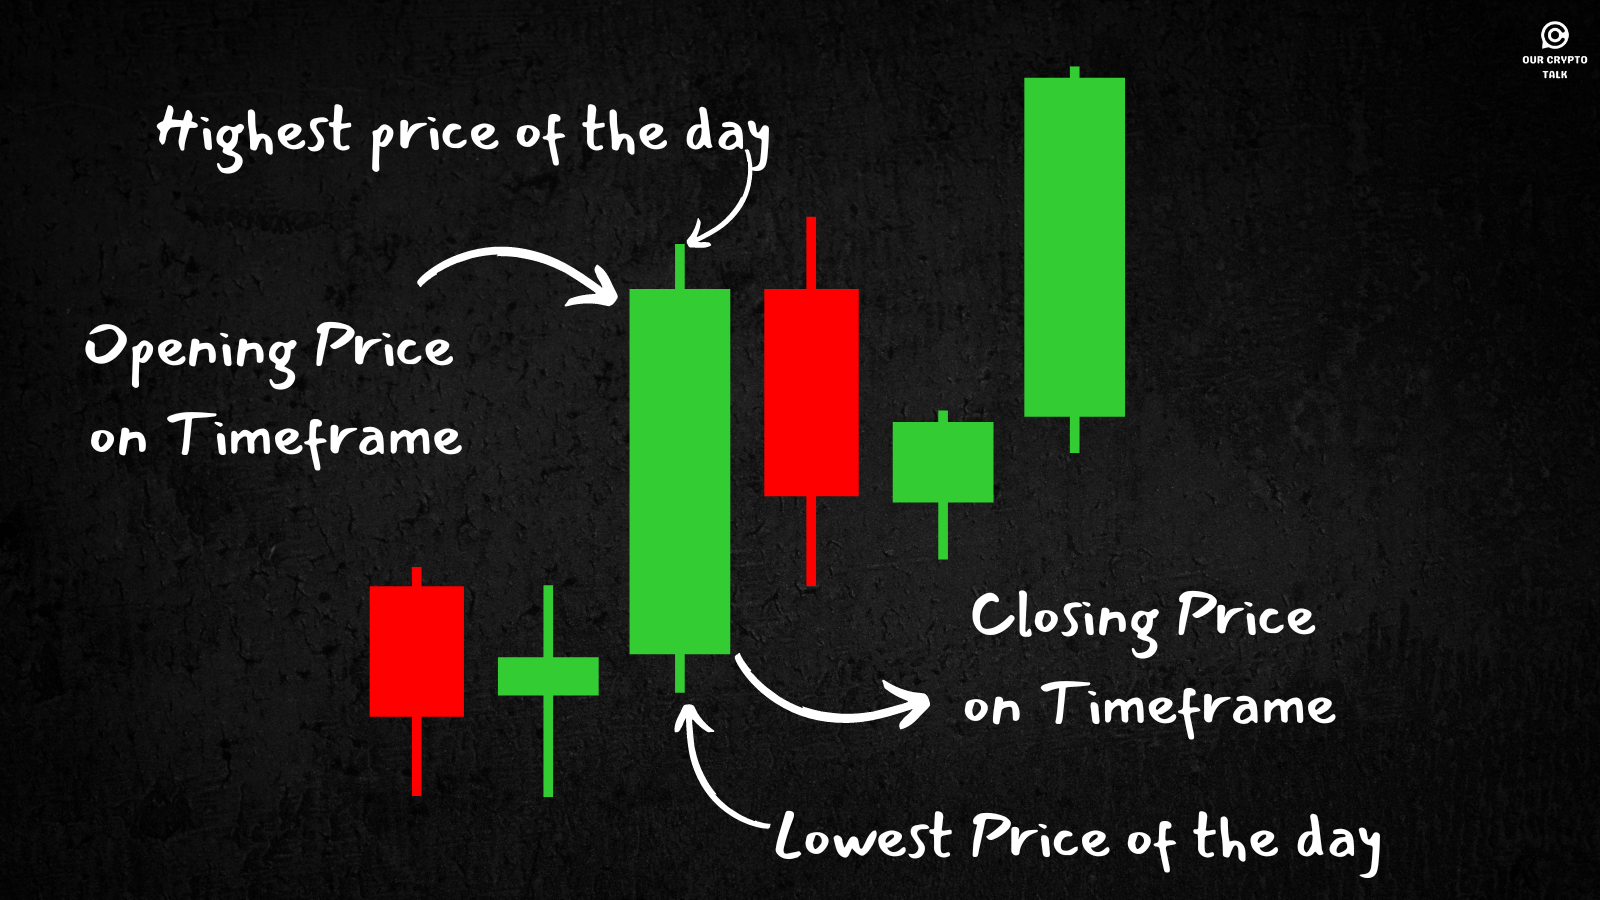
At the heart of crypto chart analysis lies the candlestick—a visual representation of price movement. Candlesticks display the opening, closing, highest, and lowest prices of a crypto asset within a specific time frame. Each candle tells a story of market activity, helping traders understand whether bulls (buyers) or bears (sellers) are in control.
Each candlestick has two parts: the body and the wicks (also known as shadows). The body shows the range between the opening and closing prices. If the closing price is higher than the opening, the candlestick is typically colored green, indicating a bullish (upward) movement. If the closing price is lower than the opening, the candlestick is usually red, indicating a bearish (downward) movement.
The wicks extend from the top and bottom of the body and represent the highest and lowest prices during the period. Wicks are essential in identifying volatility—long wicks often indicate market indecision or a possible reversal.
Candlesticks form the basis of chart reading, and by mastering their structure, traders can quickly gauge market sentiment. In the next section, we’ll dive into how to interpret these candlesticks to better understand market conditions.
Reading candlesticks involves understanding what each candle reveals about market dynamics. There are two main types of candlesticks: bullish and bearish.
Besides single candlesticks, certain patterns can signal future market movements. Some essential candlestick patterns include:
By learning to read these candlestick patterns, you can better anticipate price movements and adjust your trading strategy accordingly. This forms the foundation of effective crypto chart reading and helps traders make sense of price fluctuations. Next, we’ll discuss how to identify long-term trends.
Understanding long-term trends is essential for making informed investment decisions and a big part of knowing how to read crypto charts. Trends represent the general direction of an asset’s price over a specified period and can be upward, downward, or sideways. Identifying these trends helps traders avoid chasing short-term market noise and instead focus on the bigger picture.
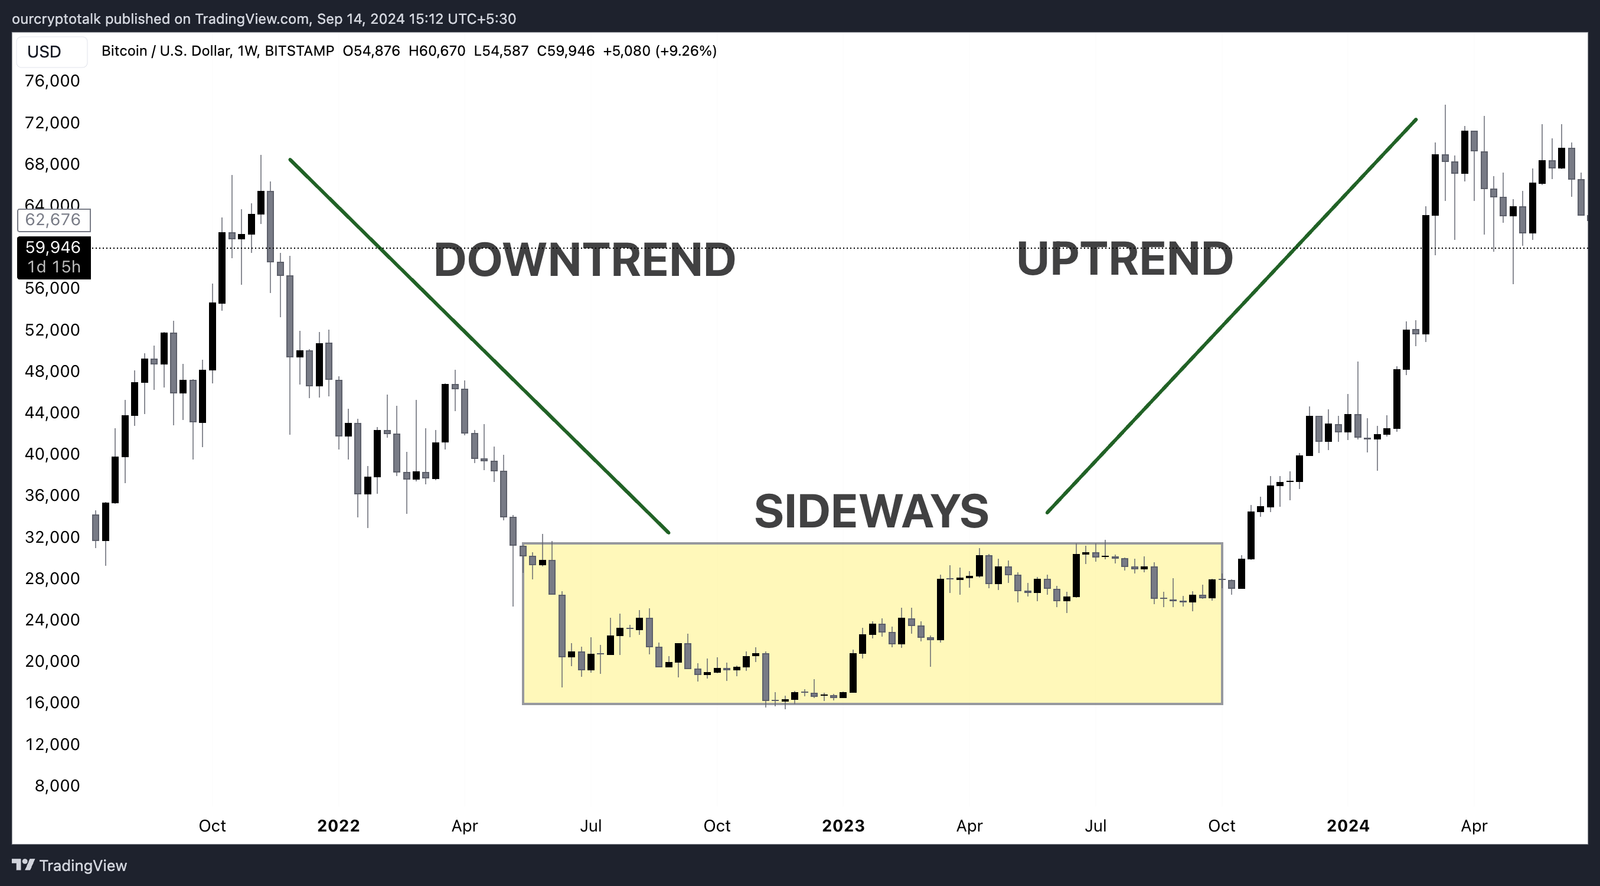
There are three key types of trends to watch for in crypto charts:
By using trendlines—diagonal lines that connect key price points—traders can visualize trends more clearly. Drawing a trendline between higher lows in an uptrend or lower highs in a downtrend can help confirm the market’s direction. Recognizing these trends allows you to develop more strategic entry and exit points.
Wicks (or shadows) on candlesticks provide critical insights into market activity. They represent the highest and lowest prices reached during the candle’s timeframe, even if those prices were only briefly touched. Wicks can reveal essential information about market volatility and potential reversals.
Here’s how wicks can impact your analysis:
Wicks often form during moments of market indecision or sharp price movements, giving traders valuable insight into who holds control—buyers or sellers. Paying attention to the length and direction of wicks helps predict future market behavior, particularly during times of high volatility.
Chart patterns are visual formations created by the price movement of an asset over time. These patterns often repeat and can provide traders with clues about potential future price movements. Recognizing these patterns is a key part of technical analysis. Knowing the possible formations of the candlesticks is important in knowing how to read crypto charts.
Here are three simple yet powerful chart patterns that every crypto trader should know:
Recognizing these simple chart patterns helps traders identify possible entry and exit points, giving them an edge in forecasting price movements. Mastering these patterns allows you to act quickly when opportunities arise in the market.
Moving averages (MAs) are a popular tool used to smooth out price data and make it easier to identify trends. Instead of focusing on the short-term fluctuations in price, moving averages take the average price of an asset over a specified period, helping traders focus on the overall market direction.
There are two main types of moving averages:
Moving averages can act as dynamic support and resistance levels. For instance, when the price crosses above a moving average, it might indicate a potential buy signal. Similarly, when it crosses below, it could suggest selling. Many traders use combinations of moving averages (such as the 50-day and 200-day) to identify “golden crosses” (bullish signals) or “death crosses” (bearish signals).
Volume refers to the number of assets traded during a specific period, and analyzing volume is crucial for understanding the strength or weakness of a price move. When the price moves with high volume, it indicates strong market interest, while low volume may suggest weak conviction.
Here’s how to use volume to interpret market moves:
By combining price movements with volume data, traders can get a clearer picture of whether a trend is likely to continue or reverse. Volume spikes at key levels like support or resistance can provide further confirmation of potential breakouts or breakdowns, making it an essential tool for chart reading.
You can learn more about these metrics and indicators in our Best Indicators On TradingView section
Understanding how to read crypto charts is a crucial skill for both novice and experienced traders. By mastering the art of analyzing candlestick patterns, identifying trends, recognizing key support and resistance levels, and interpreting chart wicks, you can significantly improve your trading decisions. While chart reading may seem intimidating at first, consistent practice and a solid foundation in charting tools will make it easier over time. Ultimately, the goal is to use charts to anticipate price movements, manage risk effectively, and seize profitable opportunities in the volatile crypto market.
Key Takeaways:
TL;DR: The question that how to read crypto charts may seem complicated, but once you grasp candlesticks, trends, and patterns, you can predict price movements more effectively. From understanding wicks to identifying key support and resistance levels, these are essential skills for any crypto trader to succeed.


