In crypto numbers tell a story far deeper than the price of a token. One of the most important numbers is the circulating supply. Unlike traditional fiat money, which can be printed by central banks, crypto supply is defined by code and consensus. This makes circulating supply a core metric for anyone trying to judge scarcity, value, and potential price movement.
At its simplest, circulating supply is the amount of cryptocurrency that is currently tradable, spendable, or holdable by the public. It excludes locked tokens, reserves, and coins that have been permanently burned. Think of it as the liquid cash of a blockchain economy—the part people actually use.
Why does it matter? Because circulating supply directly influences:
Scarcity: Fewer coins in the market often means higher perceived value.
Market Cap: Calculated as price × circulating supply.
Investor Confidence: Clear data prevents hidden inflation or dilution surprises.
Bitcoin made this concept famous. When Satoshi Nakamoto capped Bitcoin at 21 million coins, he baked scarcity into its DNA. By 2025, around 19.9 million Bitcoin are already circulating, leaving little room for inflation. Other cryptos take different paths—Ethereum, for example, has no hard cap but uses burning and staking to manage supply growth.
For investors, understanding circulating supply crypto metrics is not just about technical definitions. It is about protecting themselves from hype, spotting dilution risks, and grasping how scarcity narratives drive valuation.
Circulating supply in crypto refers to the number of tokens available in the market at a given moment. These tokens are liquid, meaning they can be traded, spent, or held by anyone.
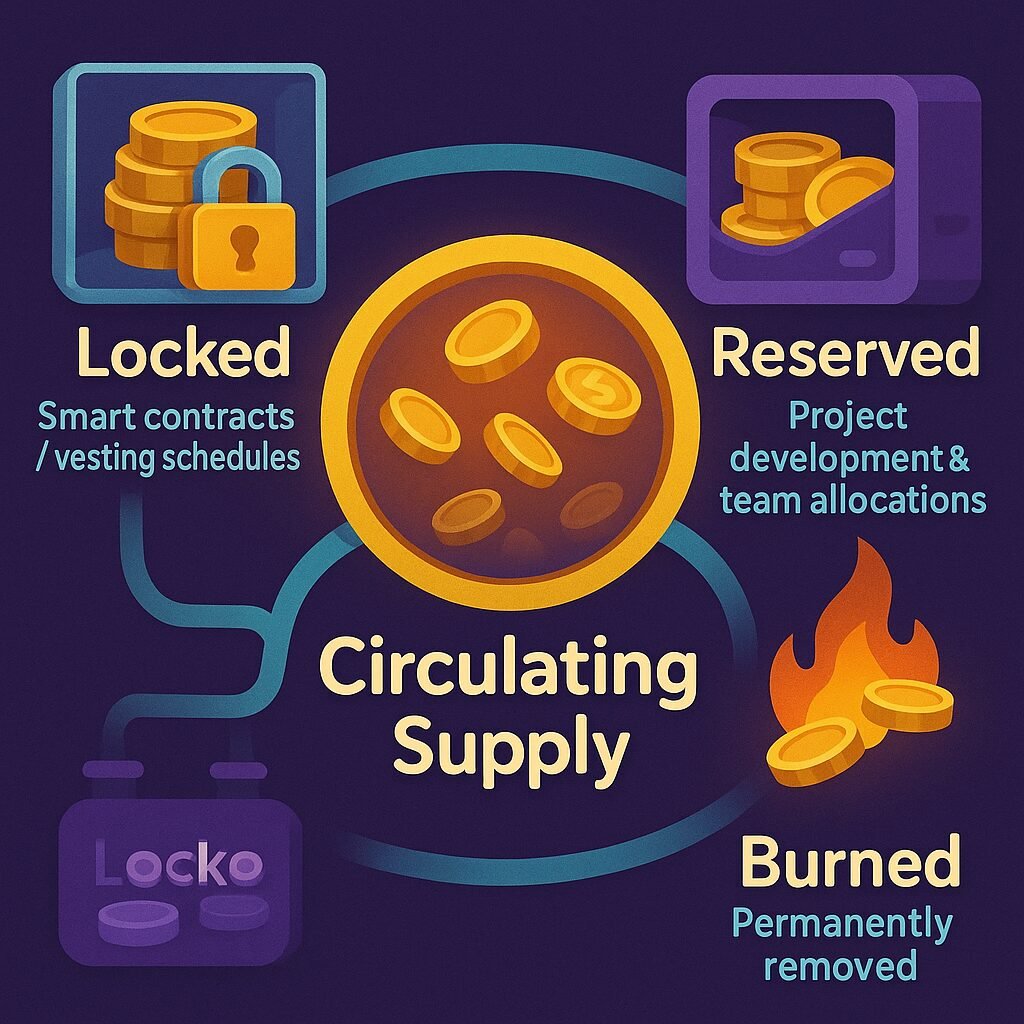
It excludes tokens that are:
Locked: Held in smart contracts or vesting schedules.
Reserved: Saved for project development or team allocation.
Burned: Sent to inaccessible addresses, permanently removed from circulation.
Why this matters:
A project may have minted 1 billion tokens, but if 400 million are locked for team incentives, the circulating supply is only 600 million.
Price action is tied to what people can actually trade, not the total created.
Blockchain transparency makes circulating supply easier to verify than in traditional finance. Tools like Etherscan for Ethereum or Solana Explorer for Solana allow anyone to confirm supply figures. Data sites such as CoinMarketCap and CoinGecko aggregate this information, but savvy investors often double-check on-chain sources.
A useful analogy is to think of circulating supply as the money people carry in their wallets, while total supply includes reserves stored in a vault. The wallet money drives day-to-day transactions and market activity.
Investors use circulating supply to:
Judge maturity: Older projects like Bitcoin have most of their supply circulating.
Spot risks: Newer projects often have a small fraction circulating with big unlocks ahead.
Track manipulation: Sudden supply increases from unlocked tokens can pressure prices.
In short, circulating supply is the liquid heartbeat of a crypto economy, and ignoring it leaves investors blind to how value is actually distributed.
Circulating Supply vs Total Supply vs Maximum Supply
The terms often get mixed up, but they are very different. To avoid confusion, let’s break them down:
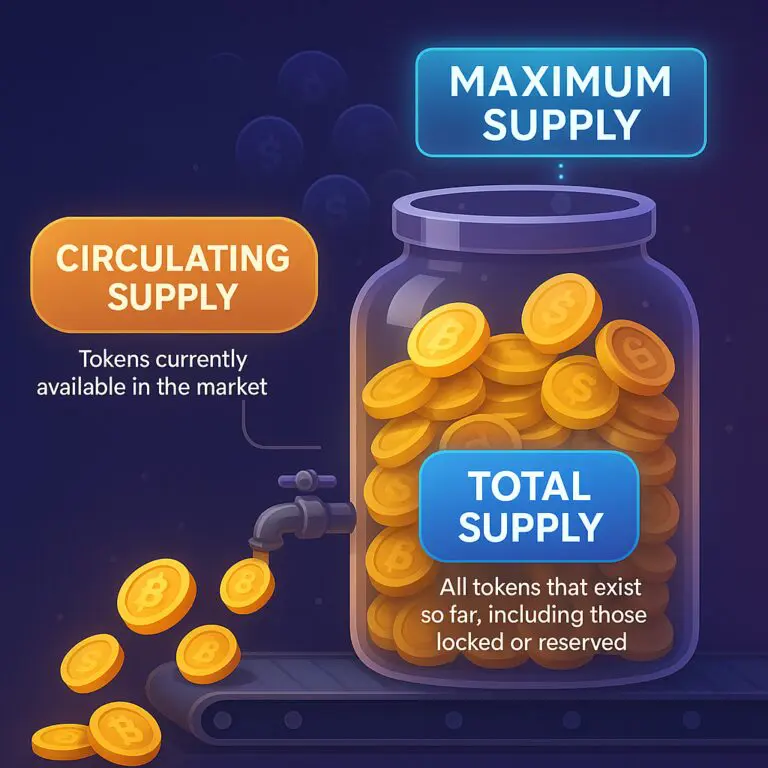
Circulating Supply -> Tokens currently available in the market for trading.
Total Supply -> All tokens that exist so far, including those locked or reserved.
Maximum Supply (Max Supply) -> The absolute cap of tokens that will ever exist.
Locked Tokens: Coins held in vesting schedules or smart contracts, not tradable yet.
Reserved Tokens: Allocations for development, partnerships, or team incentives.
Burned Tokens: Coins sent to “dead” addresses and permanently removed.
Methods of Calculation
On-chain verification
Block explorers like Etherscan or Solana Explorer show exactly how many tokens exist.
Lost coins (e.g., Bitcoin wallets with forgotten keys) complicate the picture, since they still count technically but are unusable.
Self-reporting by projects
Many projects submit supply data to aggregators such as CoinMarketCap or CoinGecko.
These figures are usually cross-verified, but errors or intentional manipulation can occur.
Audited data
Research firms like Messari provide vetted supply metrics, often using analytics dashboards like Dune to track supply changes in real time.
Case Examples
Bitcoin: Supply is simply the number of mined coins from blocks, minus unclaimed or lost BTC. Estimates suggest 3–4 million BTC are lost, meaning the effective circulating supply is lower than the reported 19.9 million.
Ethereum: Post-Merge, staked ETH is still considered circulating because it can be withdrawn and traded. Burned ETH from EIP-1559, however, reduces net supply.
Solana: As of 2025, circulating supply (~540M) comes from its initial mint (500M), minus burns, plus inflation rewards and unlocks.
Investor Tips
Always confirm figures on explorers rather than relying only on aggregator sites.
Watch out for projects that inflate “circulating supply” numbers by counting tokens that are technically locked.
Price alone misleads—market cap and FDV matter more.
Always compare circulating supply against max supply to gauge scarcity.
A coin with “only 1 cent” price may actually be overvalued if supply is massive.
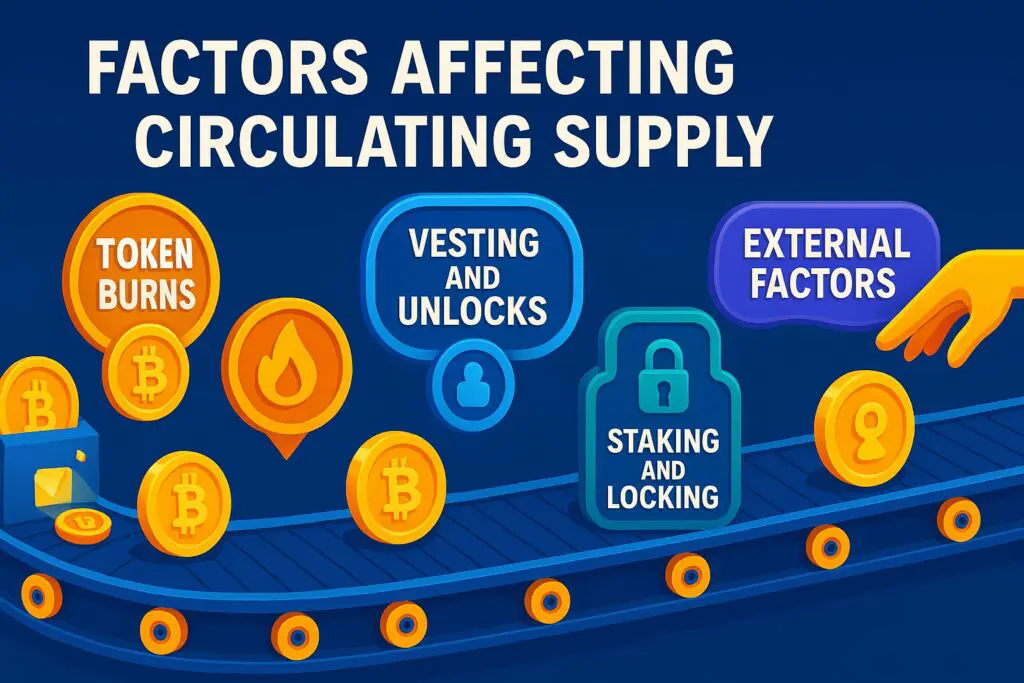
Factors Influencing Circulating Supply In Crypto
Circulating supply is not fixed—it changes over time. Multiple factors dynamically shape it, making it essential to monitor regularly.
1. Mining and Issuance
Bitcoin: New BTC enters circulation through block rewards, halved every four years. After the 2024 halving, rewards are 3.125 BTC per block, slowing supply growth.
Ethereum: Post-Merge, new ETH enters circulation through staking rewards, adding about 0.5–1% annually.
2. Token Burns
Permanently remove tokens from supply.
Ethereum (EIP-1559): Burned over 4M ETH by 2025, worth billions, making ETH deflationary during high activity.
BNB: Binance’s quarterly burns reduced billions of tokens, supporting scarcity.
Meme coins: Dogecoin or Shiba Inu communities burn tokens for hype, though effects are often short-lived.
3. Vesting and Unlocks
Founders and early investors usually have tokens released gradually.
Solana: Unlocks in 2024–2025 added millions of tokens to circulation, sometimes pressuring price.
Unlock schedules are published but often overlooked by retail investors.
4. Staking and Locking
Staked tokens are considered circulating since they can be traded once unstaked, but they are temporarily illiquid.
Ethereum burns make it deflationary in busy times.
Solana balances inflation with staking and burns.
Risks: Misreporting, hype around “low supply,” ignoring FDV.
Smart investors pair supply metrics with fundamentals and demand.
Conclusion
Circulating supply has become one of the most important metrics in crypto. It acts as a window into scarcity, market cap, and long-term sustainability. But it’s only powerful when understood in context. A token’s price means little without knowing how many coins are truly circulating, how many are locked, and what future unlocks look like.
Bitcoin’s hard cap shows how scarcity can drive adoption. Ethereum’s dynamic burns prove that flexible supply can still sustain value. Solana’s growth highlights how staking and adoption balance inflation. Across all examples, one truth stands out: supply models shape narratives, and narratives shape markets.
Looking ahead, as tokenomics evolve for new categories like AI-powered coins or DePIN projects, circulating supply will remain a critical reference point. Investors who dig beyond surface-level price action and study supply metrics will be better positioned to separate hype from value.
Circulating supply crypto analysis is not about memorizing formulas. It is about asking the right questions: How many tokens are liquid today? How many more could enter the market? And does demand match the supply story? Those who master these questions will navigate the volatility of crypto with far more confidence.
Frequently Asked Questions
What is circulating supply in cryptocurrency?
Circulating supply refers to the number of tokens that are currently tradable, spendable, or holdable by the public. It excludes locked, reserved, or permanently burned tokens. Think of it as the liquid cash of the blockchain economy.
Why does circulating supply matter?
It impacts scarcity, market capitalization (price × circulating supply), and investor confidence. A transparent circulating supply prevents hidden inflation and helps investors assess dilution risks.
How is circulating supply different from total and maximum supply?
Circulating supply = tokens actively in the market.
Total supply = all tokens minted so far, including locked or reserved.
Maximum supply = the absolute cap that can ever exist.
Example: Bitcoin has a max of 21M, Ethereum has no cap but uses burns, and Solana adjusts through inflation and burns.
How is circulating supply calculated?
Circulating Supply = Total Supply – (Locked Tokens + Reserved Tokens + Burned Tokens).
Verification is done via block explorers, self-reported data, or independent audits. For example, Bitcoin supply comes from mined coins, while Ethereum adjusts with staking and burns.
What factors influence circulating supply over time?
Key factors include mining/issuance (e.g., Bitcoin halving), token burns (ETH, BNB), vesting/unlocks (Solana), staking participation, and external events like hacks or regulatory freezes.
Why is circulating supply important for investors?
It shapes valuation through market cap and fully diluted value (FDV), reveals scarcity, and highlights dilution risks. Comparing circulating, total, and max supply helps investors avoid hype and spot sustainable projects.
What are the risks or misconceptions around circulating supply?
Risks include misreporting, confusing definitions of staked tokens, and ignoring lost coins. Misconceptions include assuming low supply guarantees scarcity or that burns always increase value. Supply data must be paired with real demand and adoption.