Loading Search...
Bitcoin faces key structural tests. This opinion explores the uncomfortable price levels bulls don’t want to price in.
Author: Arushi Garg
Bitcoin is struggling to break above the $69,000 level. Momentum is slowing, and several technical indicators suggest the market may need a larger reset before any sustained move higher. Most investors prefer upside projections. It is easier to discuss six-figure targets than to consider uncomfortable scenarios like $40,000 or even $30,000 per BTC. But ignoring downside math does not remove the risk.
When Bitcoin corrects, the market splits into two groups. One group immediately calls it a buying opportunity. The other zooms out and studies long-term charts.
This article takes the second approach. Rather than relying on sentiment, we examine Bitcoin’s macro structure using measurable data. The goal is to calculate potential downside levels if a deeper correction unfolds.
We will analyze five independent long-term metrics:
Each metric measures a different aspect of the market, including momentum, cycle timing, retracement depth, volatility phase, and structural support. If several tools point toward similar levels, those zones deserve attention.
If multiple indicators point toward the same price region, it is rarely a coincidence. Confluence often matters more than any single signal on its own.
Let’s break them down one by one.
The Relative Strength Index, or RSI, measures momentum. On higher timeframes such as the weekly chart, it helps identify when selling pressure is becoming statistically stretched. It does not predict an exact price target, but it highlights zones where downside momentum may be reaching exhaustion.
Throughout Bitcoin’s history, a weekly RSI reading in the low 30s or high 20s has often marked macro exhaustion zones. This occurred during the late 2018 bear market and again in late 2022. In both cases, Bitcoin was either at the bottom or very close to forming it.
Momentum typically leads price. When the weekly RSI compresses into extreme levels, it signals that sellers may be running out of strength, even if price action still appears weak.
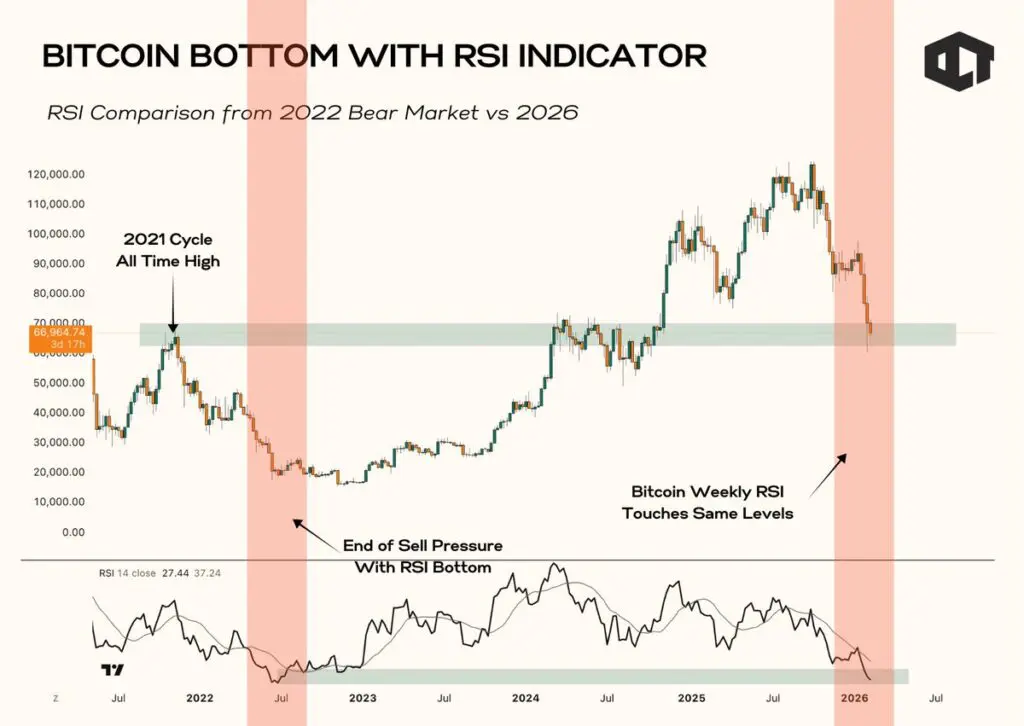
In the chart, the 2022 bear market RSI bottom is clearly marked. Now in 2026, the weekly RSI is revisiting nearly identical levels. This similarity is difficult to ignore from a structural perspective.
Price is currently sitting near the prior 2021 cycle all-time high zone around $69,000. Historically, previous cycle highs often act as strong support during major corrections. However, in 2022, RSI did not bottom at the first major support level. It bottomed only after a final flush that pushed momentum into deeper exhaustion.
If the current RSI trajectory mirrors the 2022 structure, the market may require one more downward wave before a reversal forms. Statistically, that scenario aligns with Bitcoin testing the $55,000 to $60,000 region.
Momentum-based bottoms typically form after panic acceleration rather than a slow, gradual bleed. Sharp sell-offs tend to compress RSI quickly and create exhaustion conditions.
If RSI completes a similar compression pattern, the most likely window for a bottom would be within the next one to two quarters. Historically, momentum exhaustion tends to precede recovery by weeks, not months.
The weekly RSI suggests that if a final flush occurs, the $55,000 to $60,000 region becomes a high-probability exhaustion zone. It does not imply structural collapse. It points to one final stretch before stabilization.
Bitcoin operates in halving-driven cycles. After each halving event, price typically enters a profitability expansion phase that eventually peaks and transitions into distribution.
The halving profit indicator measures how long Bitcoin remains in its historical high-profit window before entering deeper retracements. In both the 2017 and 2021 cycles, once this window closed, price retraced between 30% and 45% from the post-halving high before resetting into a new accumulation phase. Cycles are never identical, but they often follow similar structural rhythms.
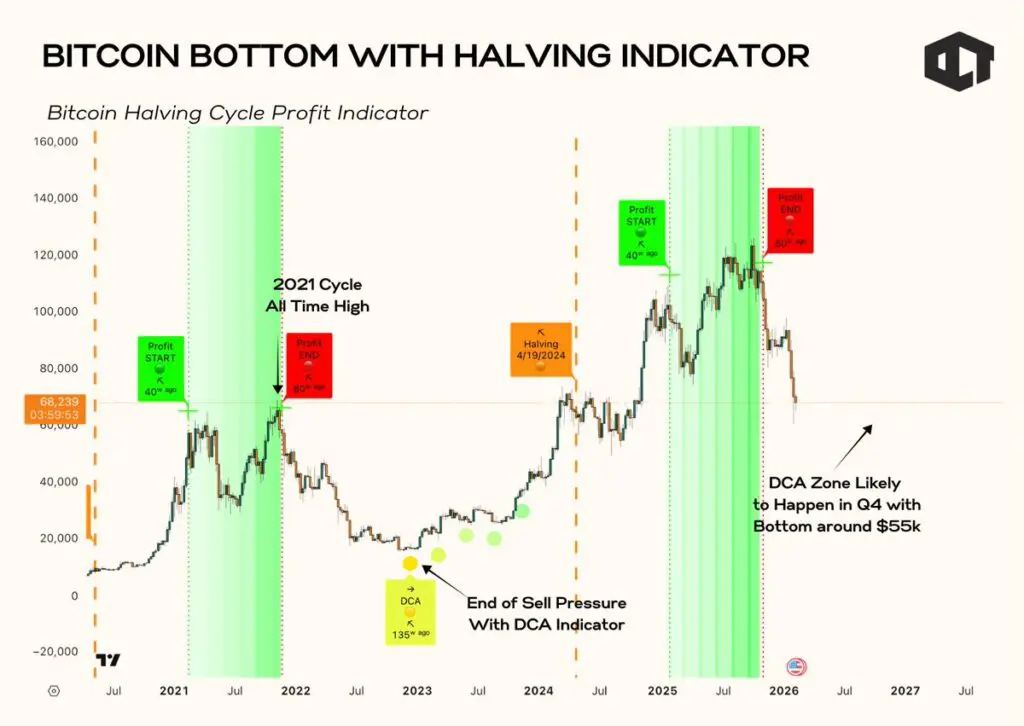
The 2024 halving triggered a strong expansion phase that carried into 2025, with price topping in the $110,000 to $120,000 region. That move marked the peak of the profitability window that historically follows each halving cycle.
We are now outside that peak profit phase. In previous cycles, once the expansion period ended, Bitcoin compressed back toward major structural support zones. These pullbacks created conditions for long-term holders to reaccumulate before the next cycle began.
A 40% retracement from $110,000 projects toward $66,000. A 50% retracement projects closer to $55,000. Historically, post-profit resets have averaged near a 45% pullback, which places structural support in the $55,000 to $60,000 range.
Halving cycle resets typically occur within 18 to 24 months after the halving event. The market is currently within that window. If this cycle follows the historical pattern, the bottom would likely form within the same year as the first major post-halving correction.
If that structure fails to repeat, it would challenge the traditional four-year cycle thesis that has guided Bitcoin’s macro behavior for over a decade. Based on historical timing symmetry, this suggests a potential bottom forming within the next two to three quarters.
Cycle mathematics suggests that the high-probability reset zone sits near $55,000. That level aligns with the historical average retracement following the end of a halving-driven profit phase.
Anything significantly deeper would signal a deviation from prior cycle behavior and potentially challenge the reliability of the four-year structure.
Fibonacci retracement measures proportional pullbacks within large impulsive trends. It helps identify how deep a correction can go while still preserving the broader uptrend. Bitcoin has historically respected deep retracement levels during macro resets. The 0.786 level is particularly important because it represents a near-complete correction without fully invalidating the long-term trend.
In 2018, Bitcoin bottomed near the 0.786 retracement of the 2017 rally. In 2022, the macro low again formed close to the same 0.786 region when measured from the previous major uptrend. Deep crypto corrections often retrace between 70% and 80% before continuation, making the 0.786 level a recurring structural support zone in Bitcoin’s history.
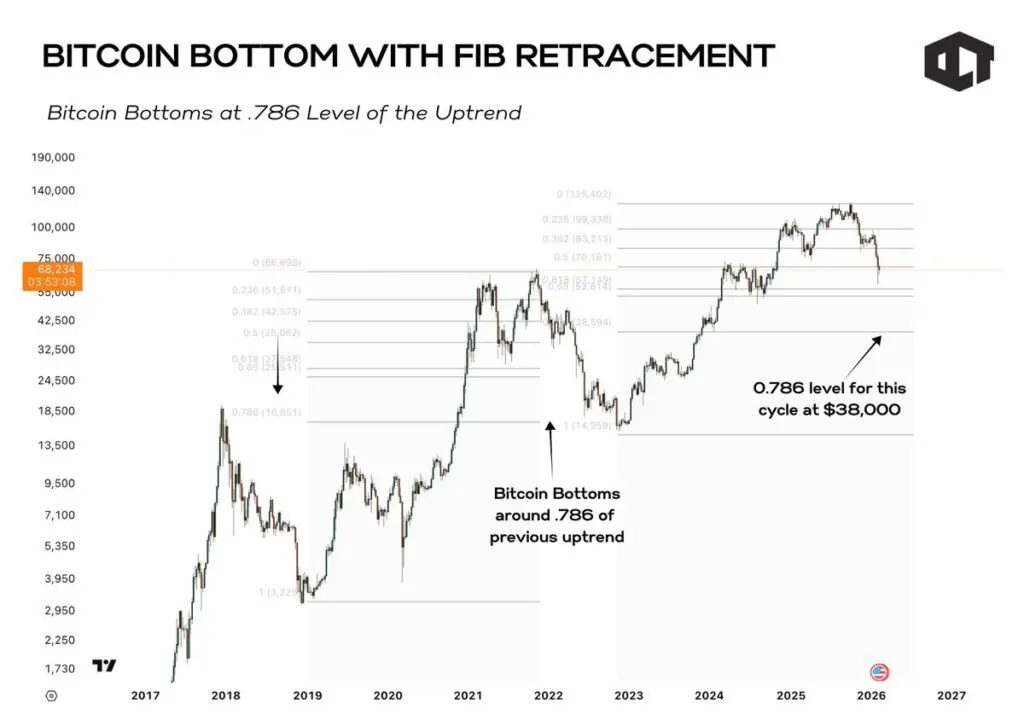
When we measure the 2023 to 2025 uptrend and apply Fibonacci from the cycle low to the cycle high, the 0.786 retracement level lands near $38,000.
That is not a comfortable number. It represents a severe pullback from the highs. However, from a structural perspective, it is clean and proportional to prior cycles. This level would also align with a breakdown of the long-term ascending wedge support, reinforcing its technical significance.
A 0.786 retracement typically occurs during full macro capitulation, not during a mild correction. It often requires forced deleveraging, liquidity tightening, or a broader macro shock to push price that deep.
Historically, retracements of this size unfold over multiple quarters rather than a few weeks. If $38,000 is to be tested, it would likely follow extended consolidation that ultimately fails, leading to sharp volatility expansion.
The $38,000 level represents the mathematically clean deep-reset zone. It is the scenario most investors prefer to ignore, but from a structural standpoint, it remains defensible.
The BB Trend indicator measures volatility expansion and compression across macro cycles. When the BB Trend turns deeply negative on higher timeframes, Bitcoin has historically entered its final capitulation phase.
This pattern appeared ahead of the 2018 bottom and again before the 2022 macro low. Volatility-based indicators do not provide exact price targets, but they help identify regime shifts from bullish expansion to bearish contraction.
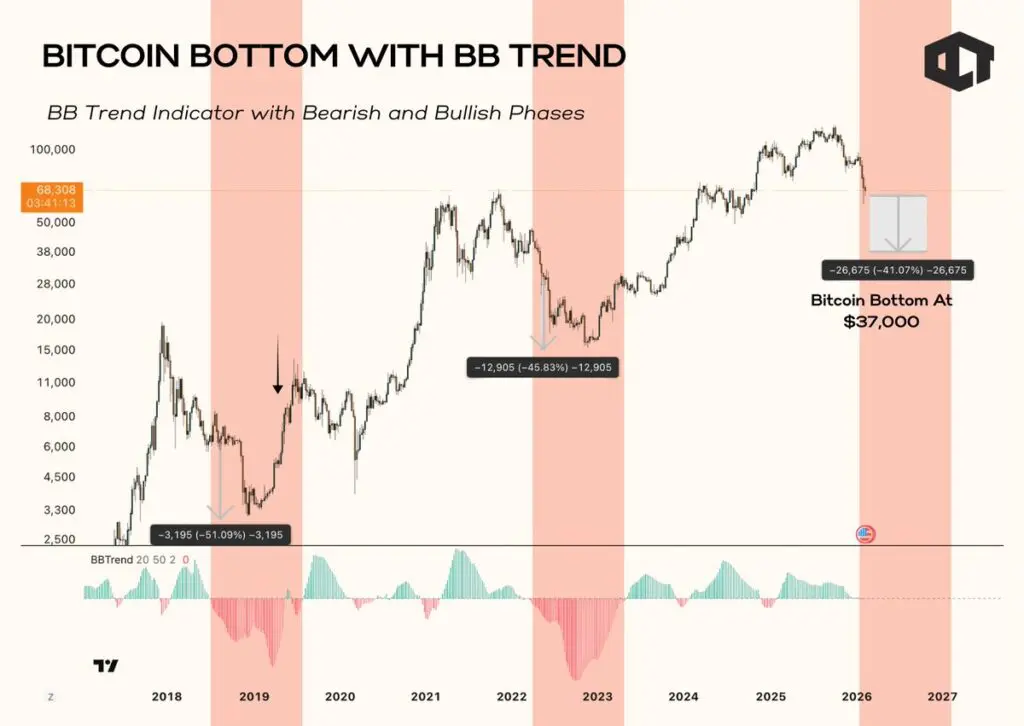
The current BB Trend is moving into deeply negative territory, similar to conditions seen near previous macro bottoms. In past cycles, peak-to-bottom drawdowns ranged between 40% and 50%, providing a useful framework for estimating potential downside.
From a $110,000 high, a 40% drawdown projects near $66,000. A 45% pullback points toward $60,000. A 50% correction brings price closer to $55,000. This range overlaps closely with the projections derived from RSI compression and halving cycle symmetry, creating a clear confluence zone.
Volatility-driven bottoms typically form after a high-volume flush that resets market positioning. The BB Trend suggests the market is in late-stage contraction, though not necessarily at peak panic yet. Historically, once volatility compresses to extremes, bottom formation unfolds over weeks rather than months.
The volatility structure again clusters around the $55,000 to $60,000 region as the most probable macro bottom zone.
Ascending wedges represent long-term rising support and resistance structures. Since 2019, Bitcoin has respected a broad rising wedge pattern, with each major correction testing the lower boundary before continuation.
When wedge support holds, price often rebounds sharply. When the structure breaks, price tends to retrace toward the origin of the wedge. Long-term trend lines carry weight because markets repeatedly react to them. Structure, over time, becomes self-reinforcing.
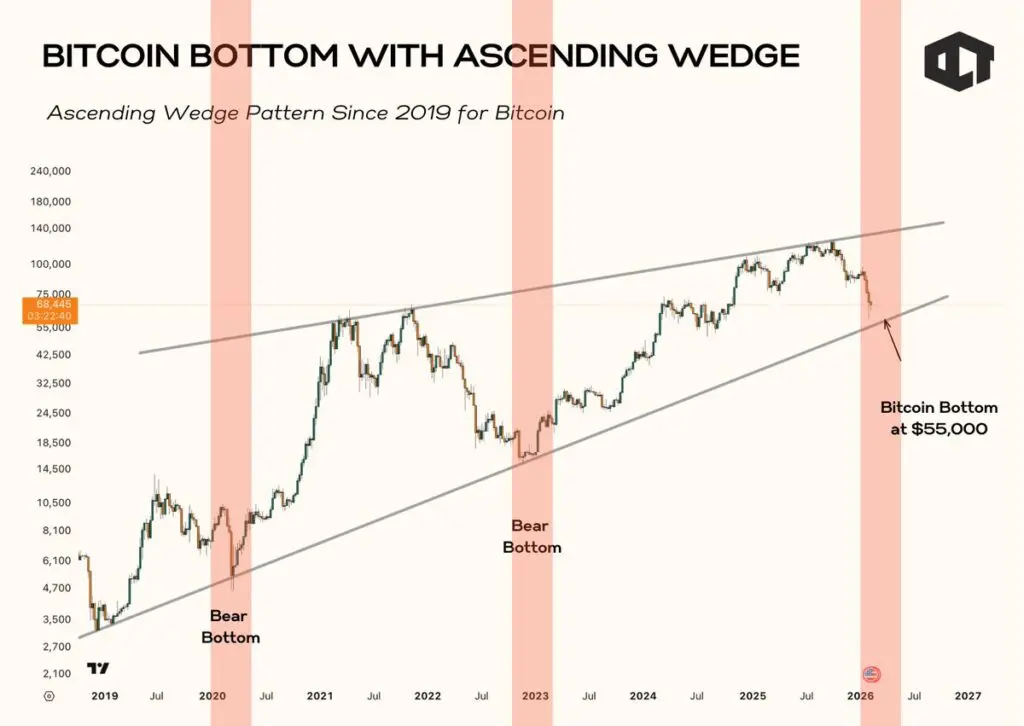
The lower boundary of the ascending wedge currently sits near $55,000. This marks the third major test of that long-term structure. If support holds again, it strengthens the thesis that $55,000 is the cyclical bottom zone.
However, if price breaks decisively below the wedge, the next major structural support aligns between $38,000 and $42,000. That region overlaps with the 0.786 Fibonacci retracement level, creating another layer of technical confluence.
Trendline breaks tend to accelerate quickly. If the wedge fails, a move toward $38,000 would likely be sharp and driven by liquidation pressure. If support holds, accumulation could begin within the next quarter as volatility compresses.
The market is sitting at a decision point. Hold $55,000 and a cyclical bottom becomes likely. Lose it, and $38,000 becomes the deeper structural magnet.
There is no single clean number. Markets do not reward precision. They reward preparation. Across momentum, halving symmetry, Fibonacci retracement, volatility compression, and long-term trendlines, one message stands out. Bitcoin does not bottom randomly. It bottoms where multiple pressures exhaust at the same time.
The primary confluence zone sits between $55,000 and $60,000. That is where RSI compresses, where historical drawdowns normalize, where halving resets align, and where multi-year wedge support currently rests.
Then there is the deeper scenario near $38,000. That level represents a full structural retracement and aligns with the 0.786 proportional correction. It becomes relevant only if liquidity tightens further or the wedge breaks decisively. One zone represents cyclical pain. The other represents structural reset. Neither represents the end of Bitcoin.
Bottoms are not events. They are processes. They form through weeks of consolidation, failed bounces, emotional fatigue, and temporary breakdowns. When reversal finally happens, it rarely feels obvious.
This is not a moment for bold predictions. It is a moment for positioning.
If $55,000 holds, accumulation in that region will look obvious in hindsight. If it fails and $38,000 becomes reality, the move will likely be fast and driven by liquidations. Historically, the best opportunities appear during discomfort, not confirmation.
The market is testing long-term structure, not short-term noise. Smart investors focus on defining invalidation levels instead of reacting emotionally. They prepare capital for volatility instead of chasing green candles. They understand that fear peaks near bottoms, not optimism.
Bitcoin has survived far deeper corrections in the past and still produced new highs. What matters is not whether price drops. What matters is whether structure remains intact after the drop.
If $55,000 becomes the floor, this will look like a healthy cyclical reset. If $38,000 prints, it will feel like panic in real time and opportunity in hindsight. The charts are not emotional. They are mathematical. And right now, they suggest preparation for discomfort before continuation. Not because Bitcoin is weak, but because that is how strong trends reset.
All the opinions in this article are that of the author and in no way are financial advice. Our Crypto Talk and the author always suggest you do your own research in crypto and to never take anything as financial advice that you read on the internet. Check our Terms and conditions for more info.