Loading Search...

A simple breakdown of crypto market structure, explaining funding rates, open interest, liquidations, spot vs perps, and order books.
Crypto market structure is one of those topics everyone nods along to but few genuinely understand. Understanding funding rates, open interest, liquidations, and order books doesn’t require a finance degree. It just requires clarity on what these metrics mean and how they affect price.
Welcome back to Explained Series #2
This guide breaks down five core concepts. Each section covers what it is, what it signals, the common trap, and how to use it.
We’ll be covering these:
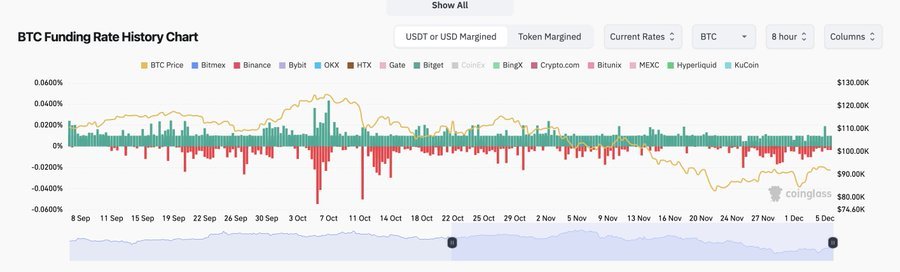
Traders exchange funding rates as periodic fees in perpetual futures markets. When funding is positive, longs pay shorts. When negative, shorts pay longs. This keeps perp prices anchored to spot.
High positive funding means the market is leaning long, while high negative funding signals a short-heavy bias. In crypto market structure, these funding extremes clearly show how the crowd is positioned and where risk concentrates.
The trap: Traders see everyone going long and pile in late, right before the reversal. Markets punish the most crowded positions.
How to use it: When funding hits extremes, stop chasing. Look for “pain trades” that squeeze the opposite direction. Funding doesn’t predict direction; it tells you where the crowd is exposed.
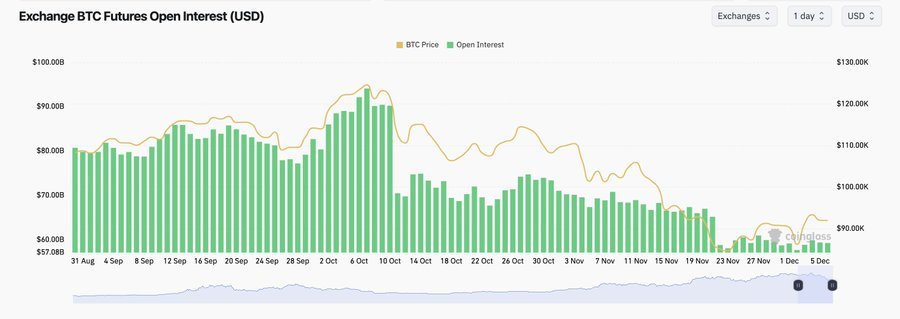
Open Interest (OI) measures how many perp contracts are currently open. Rising OI means more positions opening. Falling OI means positions closing.
When price rises alongside increasing OI, new leverage enters the market, signaling either strength or fragility within crypto market structure. If price rises while OI falls, shorts are closing and the move may fade. In crypto market structure, a price drop paired with rising OI signals new shorts piling in, setting up potential squeezes.
The trap: Rising OI is often mistaken for strength, but it creates liquidation magnets. High leverage means violent whipsaws.
How to use it: If OI spikes fast after a breakout, expect volatility and fakeouts. Prefer entries after OI cools off, when positions are less crowded.
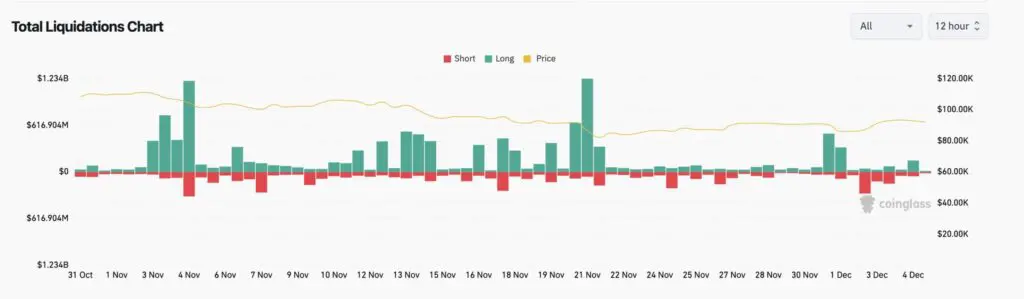
A liquidation happens when an exchange force-closes a leveraged position due to low margin. That forced closure becomes a market order, pushing price further and triggering more liquidations.
The cascade works like this: price hits a level, liquidations trigger, forced orders push price, which triggers more liquidations. You get waterfall moves.
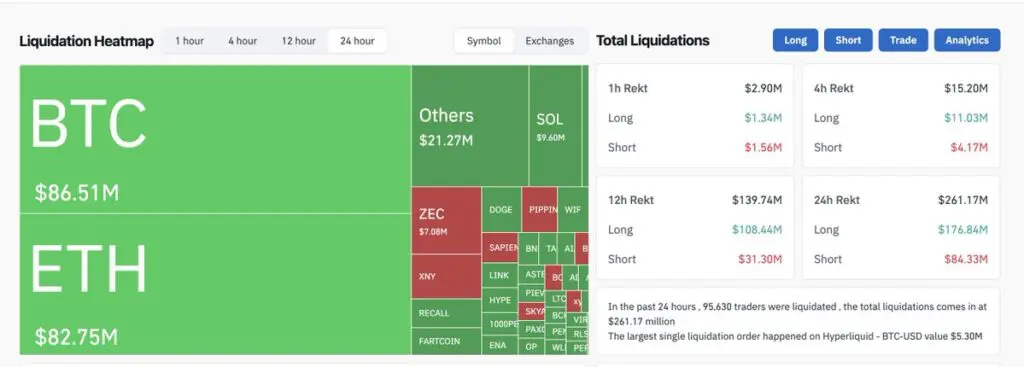
How to Read Liquidation Heat Map and Chart
1) Liquidation Heatmap (the big boxes)
2) Total Liquidations Chart (bars + price line)
The trap: Traders confuse cascades with genuine selling pressure. Sometimes it’s mostly forced orders, not real conviction. The move can reverse just as violently.
How to use it: Identify obvious liquidation zones above highs or below lows. Don’t panic-sell into the flush. Wait for forced selling to finish, then look for reclaims. The best entries often come right after liquidation wicks.
Spot markets involve actual buying and selling of the asset. Perps let traders place leveraged bets without ownership.
Spot-led moves are healthier and more sustainable, representing real demand. Perp-led moves are fragile and leverage-driven, unwinding as quickly as they build.
If price pumps but perps do most of the work (rising OI plus aggressive funding), expect snapbacks. If price pumps with calm funding and stable OI, it’s more likely real.
How to use it: Chase less when perps are screaming. Trust moves more when leverage isn’t exploding. Sustainable rallies combine spot accumulation with reasonable perp activity.
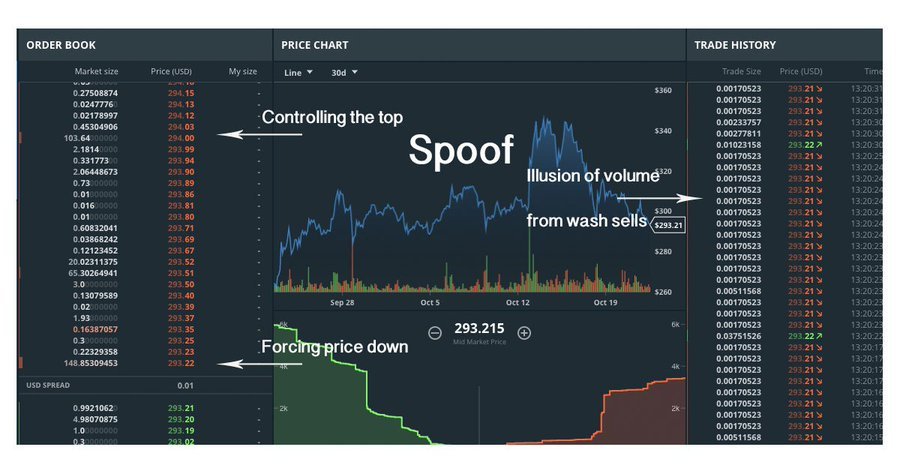
Order books show pending orders at different price levels. They display intent, not commitment. Orders can vanish instantly.
Spoofing involves placing large fake orders to manipulate perception, then pulling them before execution.
Ignore huge walls that appear suddenly and keep moving, or walls that disappear when price approaches. Watch levels that hold after multiple tests, high-volume zones that break cleanly, and sudden liquidity vacuums where price can move fast.
How to use it: Never enter just because you saw a wall. Use order books as confirmation, not your primary signal.
Before every trade: check funding, examine OI behavior, determine if it’s spot-led or perp-led, identify liquidation zones, and verify with the order book.
Trade after the crowd shows its hand, not when it’s screaming. Market structure isn’t about predicting the future. It’s about understanding where participants are positioned now and using that to avoid the traps that catch everyone else.


Former marketing lead at global Top 100 company. In crypto since 2018. Sharing strategies that actually work | NFA.
https://t.co/hF4QSf8Y0X
What Happens When All 21 Million Bitcoins Are Mined? A Beginner’s Guide
Why Does The Ethereum Foundation Keep Selling ETH?
The CLARITY Act Explained: What It Means for Your Crypto
Meta To Onboard 3.6 Billion Users Onto Web3
What Happens When All 21 Million Bitcoins Are Mined? A Beginner’s Guide
Why Does The Ethereum Foundation Keep Selling ETH?
The CLARITY Act Explained: What It Means for Your Crypto
Meta To Onboard 3.6 Billion Users Onto Web3