Loading Search...

Volume Masterclass teaches how to use the volume indicator to understand liquidity, market orders, and momentum in trading.
Most traders have the Volume Indicator just sitting at the bottom of their chart but have absolutely no idea how to use it. In this Volume Masterclass, you’ll learn how traders actually use volume to understand market activity.
I’m a former Prop Trader and have been trading Crypto for 8 years.
Thank you for taking time out of your day to read this article.
In exchange for your most valuable resource, I’m going to give you everything I know about using the Volume Indicator.
🤓 NOTE TO READER: This Volume Masterclass isn’t just going to be a bunch of theory. I’ve made sure to include real examples and tactical tips that you can implement in your trading today.
🤓 NOTE TO READER: In this Volume Masterclass, I have done my very best to simplify each of these topics so they are easy to understand and apply in trading.
Lesson 1 will cover the following:
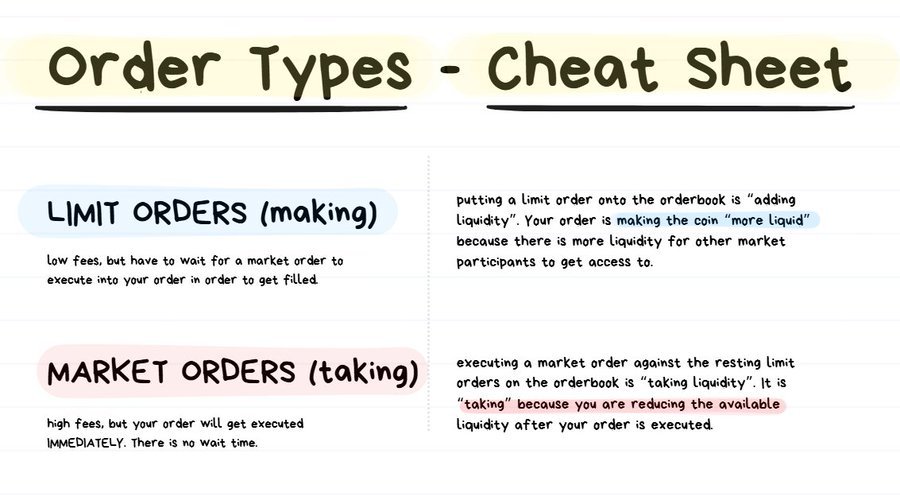
Let me give some quick context first. There are 2 types of orders that a Trader can place on an exchange. ↓
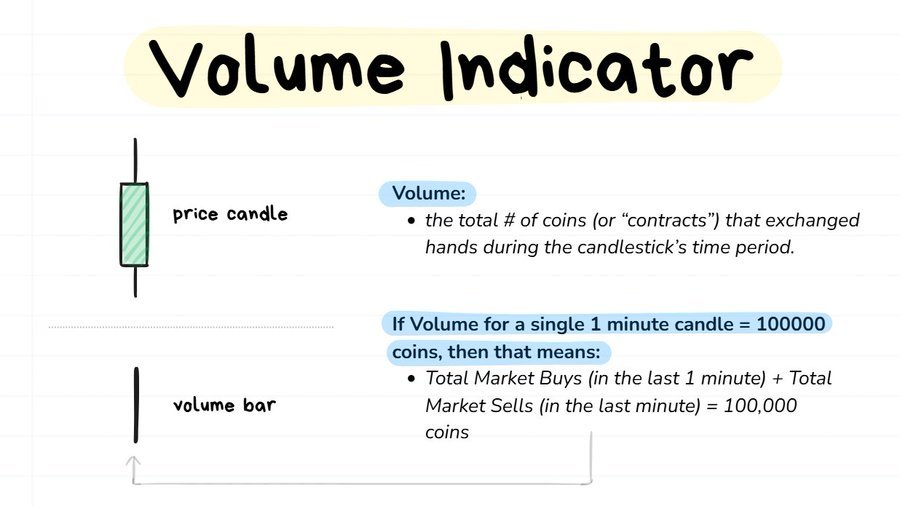
Volume = total market orders (buys + sells) that came through
That’s it. It’s really that simple.
🤔Confusion 1: “So how do limit orders get involved in volume? If trader1 market buys 1000 coins from trader2, that means 1000 coins executed as market buy and 1000 coins executed as limit sell. So is the volume 1000 or 2000?” -> Answer is 1000
Limit Orders are NOT involved in this calculation. ❌
It is ONLY Market Orders that went through. So the volume in the example above will just be 1000.
As explained in this Volume Masterclass, volume simply counts the total number of coins executed as market orders, because a trade only happens when a market order is filled.
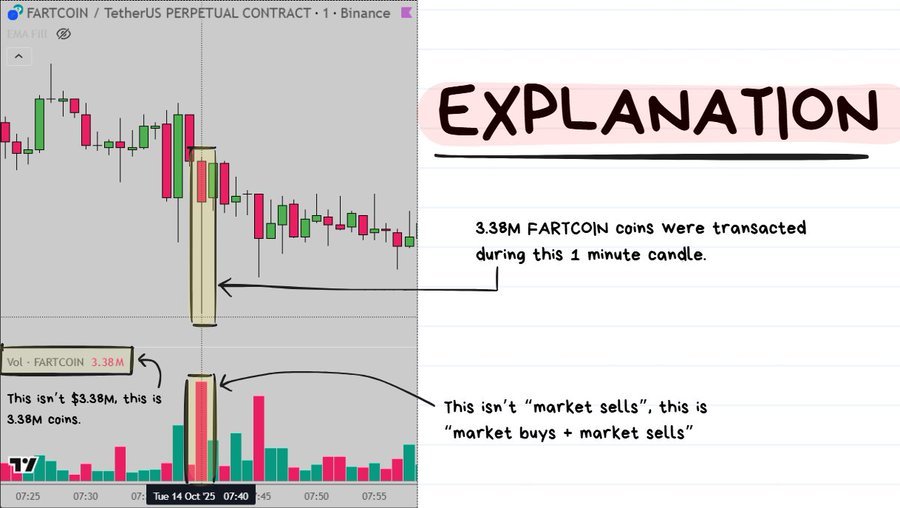
🤔Confusion 2: “On TradingView I see red volume bars and green volume bars. Do the red bars mean sell volume and the green bars mean buy volume?”
This is probably the most common thing around Volume that Traders get confused by.
The Red/Green colors on the TradingView indicator are for AESTHETICS ONLY.
❗️TIP: this is why I personally have all my volume bars set to a black color, because it’s just a “counting tool”.
Whether it’s Red or Green literally makes NO DIFFERENCE to what actually happened in the volume.
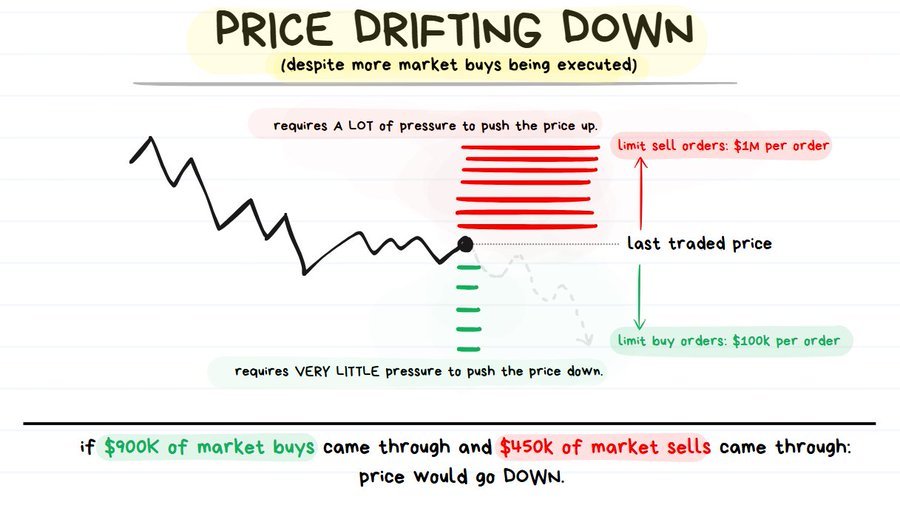
🤔Confusion 3: “If the price went up, does that mean there were more Market Buys than Market Sells? If the price went down, does that mean there were more Market Sells than Market Buys?” -> Answer is “It depends”
Lesson 2 will cover the following:
🤓NOTE TO READER: I promise to keep this lesson simple and easy to understand. I will only cover the absolute basics which I still think is quite valuable for Traders. I included this topic because I believe it’s worthwhile to think about “where is the volume actually coming from?”.
As discussed in this Volume Masterclass, game theory studies how players make decisions when the outcome for each person depends on the actions of everyone else.
Why this is a relevant topic for Traders:
The volume indicator can help give a some more context on the behavior of those players, specifically the intensity.
Can you imagine trying to win at a game but you have no idea what the rules are or how it works? The chance that you’ll do well at playing it are going to be low.
It’s important to at least know what kind of game you are playing before you try to play to win.
Some games let everyone win together. Others only reward one side at the expense of the other.
Positive Sum Games (Traders are NOT playing this game) ❌:
Zero Sum Games (Traders ARE playing this game) ✅:
🤓 NOTE TO READER: As part of this Volume Masterclass, below is a thread I wrote about different types of advantages traders can develop across multiple categories to win more than they lose over time ↓
In this Volume Masterclass, it’s important to understand who the players are in the market and what their objectives are when participating in the game.
“Know your enemy” – wise philosopher with a long beard.
Let’s break down the 3 main different types of market participants, what each of them want and what each of them really don’t want ↓
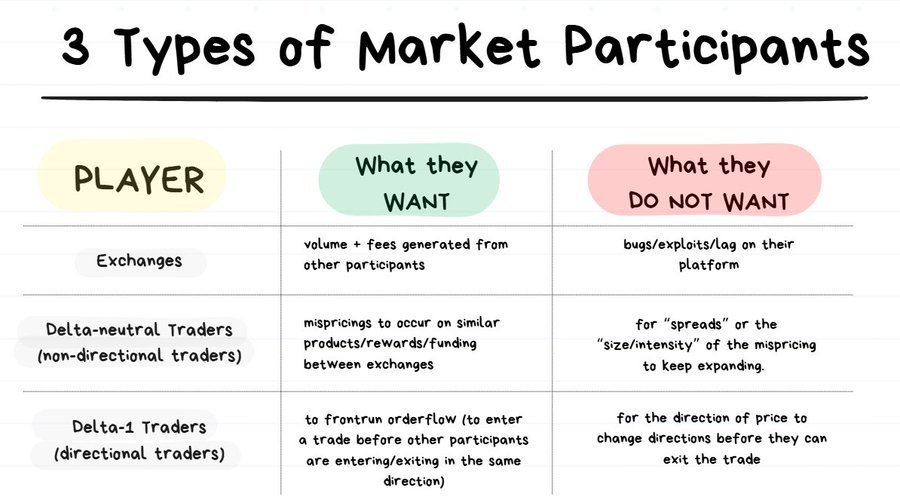
If you are a Trader who is entering a trade at a specific price and you need the price to move in your preferred direction to a target, then you will be in the 3rd Category (Delta1).
Since my trading style is trading breakouts and reversals (betting on price moving up/down), then I also am in this category. MOST TRADERS are “Delta1 Traders”.
❗️ TIP: As explained in this Volume Masterclass, Delta (Δ) measures how much the price of your position changes when the underlying asset’s price moves. A delta-1 trader has full exposure to price movement, while a delta-neutral trader aims to maintain little to no net exposure.
semi relevant tweet ↓
So we have a clear understanding of what it is that we want:
The common thing in both of these is “we need other traders”. Without other Traders entering or exiting, how is the market supposed to move?
This is why I need to be executing at places where I have at least ONE of the advantages of:
Having these 2 things in the back of my mind helps me with choosing the levels that I want to trade at and also coming up with ideas to take advantage of Traders who took “bad trades”.
❗️ TIP: As highlighted in this Volume Masterclass, trading is ultimately a zero-sum game. You get paid from the mistakes of others, so understanding what mistakes occur, how they happen, and where they appear can lead to valuable trading ideas.
❗️TIP: The more money that is “stuck” in the “wrong side” , the more fuel this is to the fire. Closing out of a losing trade is compulsory if the price keeps moving against them. It will happen either with their stoploss or a liquidation, both of which help push further in 1 direction. The more wrong they are = the more upside potential you have in the trade.
Bonus Relevant Resource #1: ↓
Bonus Relevant Resource #2: ↓
❗️ TIP: As explained in this Volume Masterclass, the more volume executed at the extreme end of a fast spike, the more fuel there is for price to violently move back toward its origin.
Trading is a zero sum game: one trader’s gain is another’s loss.
Market Players:
Key Idea: As emphasized in this Volume Masterclass, price moves only when other traders open or close positions. You profit by acting before traders on the same side or by trading against those trapped on the wrong side.
👉 To increase our chance of performing well, we should deepen our understanding with who’s in the game, what they want and how to profit from their mistakes.
Lesson 3 will cover the following:
As mentioned earlier above, we need other Traders to trade against otherwise we won’t be able to make money.
If we’re trading in a coin which has literally no volume and no liquidity, we’re just going to be shooting ourselves in the foot.
❗️TIP: Liquidity = limit orders on the orderbook. High liquidity coin = lots of limit orders sitting in the orderbook. Low liquidity coin = very few (or small) limit orders sitting in the orderbook.
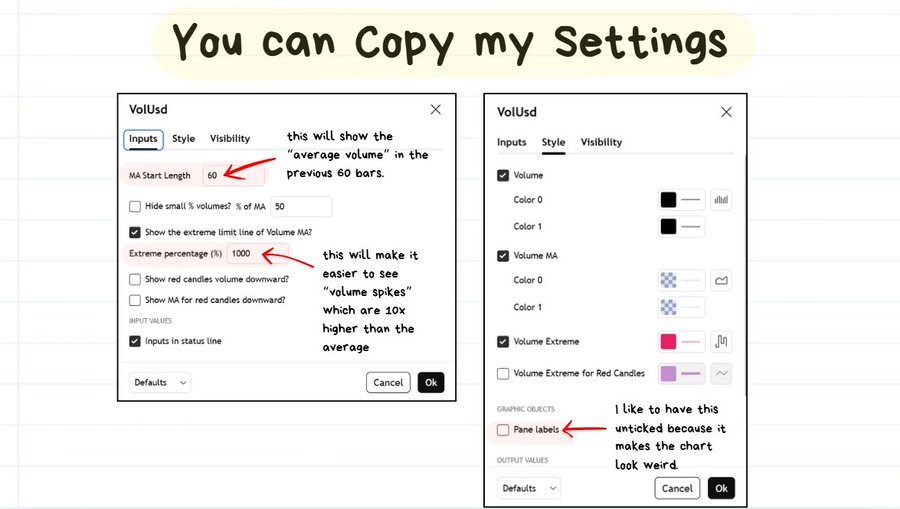
To prevent jumping into illiquid coins and getting stuck, I introduced the following Volume Filters ↓:
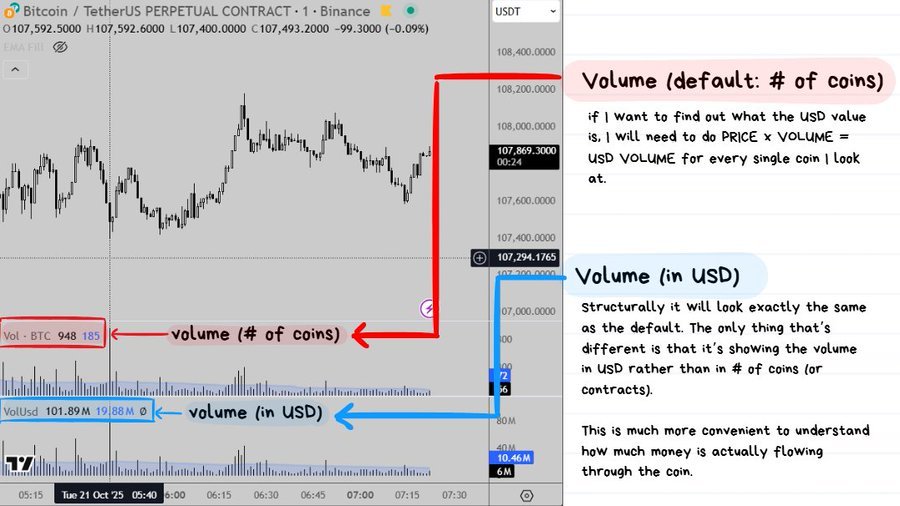
The default volume indicator shows the number of contracts that is transacted, NOT the USD which is being transacted.
This is why I have switched from the default Volume (contracts) indicator to a Volume in USD (VolUSD) indicator. It makes life so much easier.
❗️TIP: “Volume in USD” = “the Volume in contracts” multiplied by the “Price”
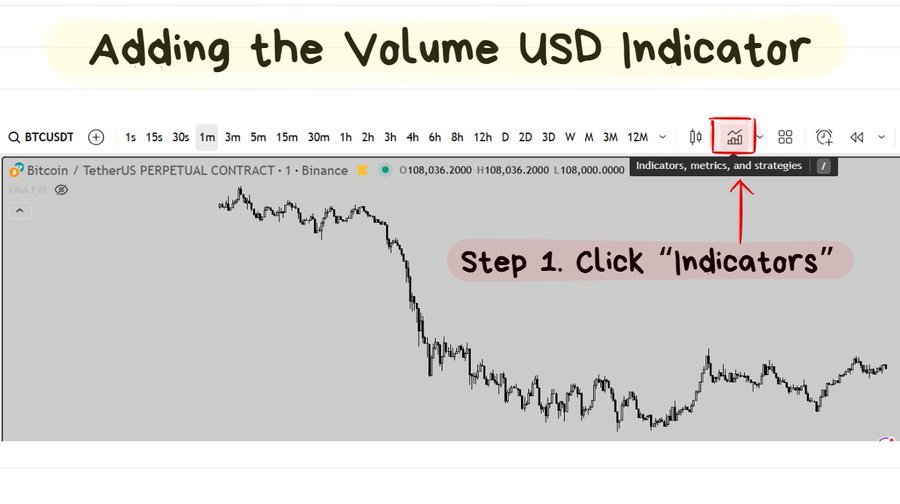
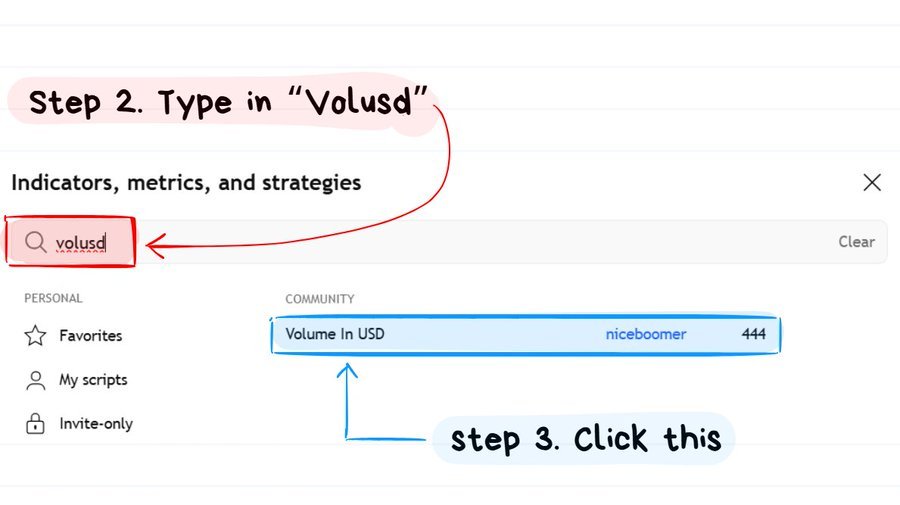
Below I will show you the instructions of how to set up this indicator↓
Below I’m going to share 2 chart examples.
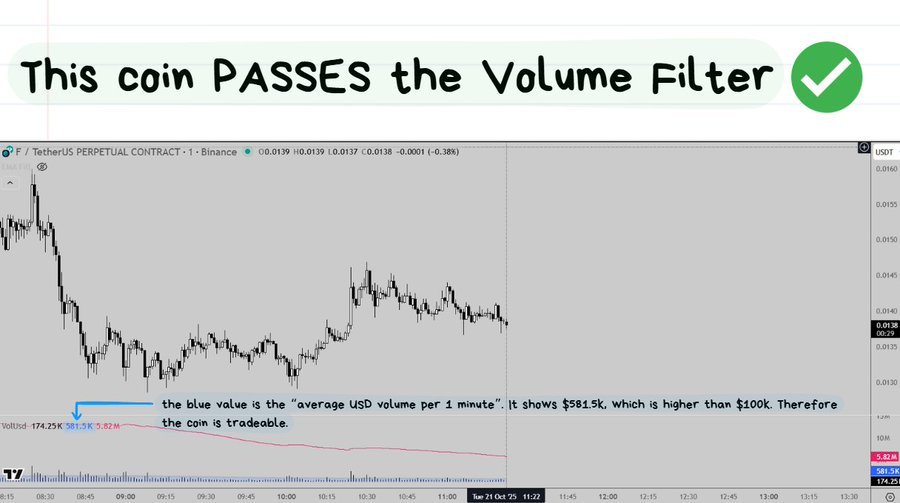
❗️ TIP: As discussed in this Volume Masterclass, even if I’m not executing trades on Binance, I still decide whether a coin is tradeable based on Binance’s volume since it leads the market in alt perpetual futures liquidity.
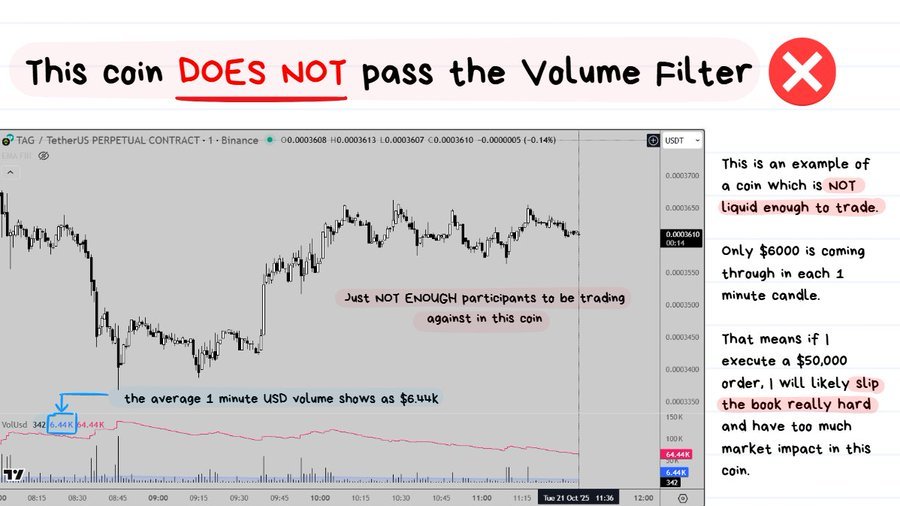
↑ Let me give some context to the image above
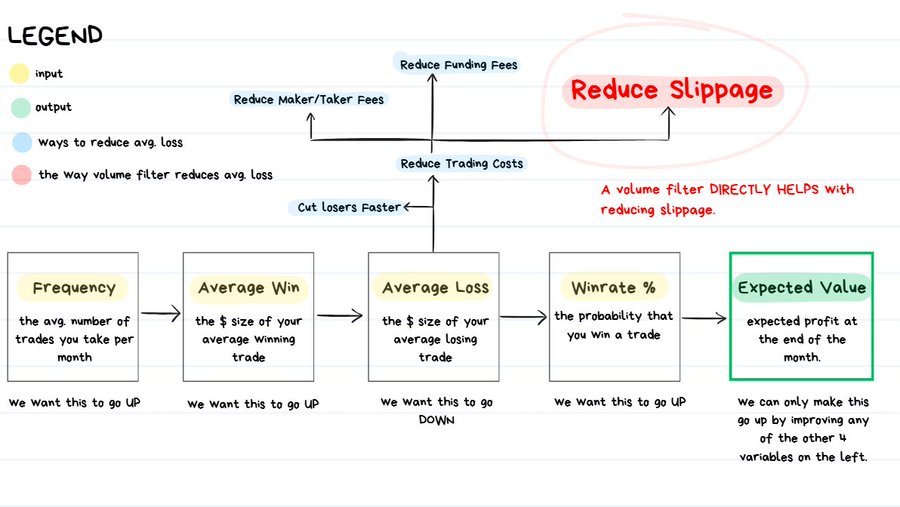
EV (expected value) per trade is where a Trader’s profits come from.
I’m not going to go into detail on all four factors here. However, as explained in this Volume Masterclass, a volume filter specifically helps reduce the average slippage per trade.
If we keep literally everything the same in a trading system but just reduce the average slippage per trade, then the profitability of the strategy goes up.
Trading illiquid coins causes slippage and losses. A volume filter prevents that.
Why it matters: Higher volume = lower slippage -> higher expected value (EV) per trade -> more profit.
🤓NOTE TO READER: Well done if you’ve made it this far. There are 2 more Lessons to go. More juicy stuff below ↓
Lesson 4 will cover the following:
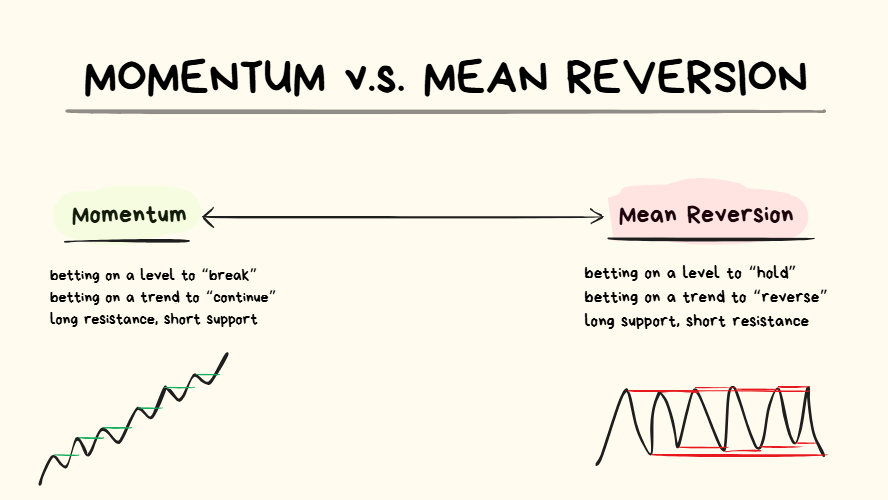
When price comes into a level, there are only 2 things that we can bet on happening:
Having a basic understanding of both momentum and mean reversion can be helpful. This is because the Volume behaves differently for the best momentum trades when compared to the best mean reversion trades.
Some quick context:
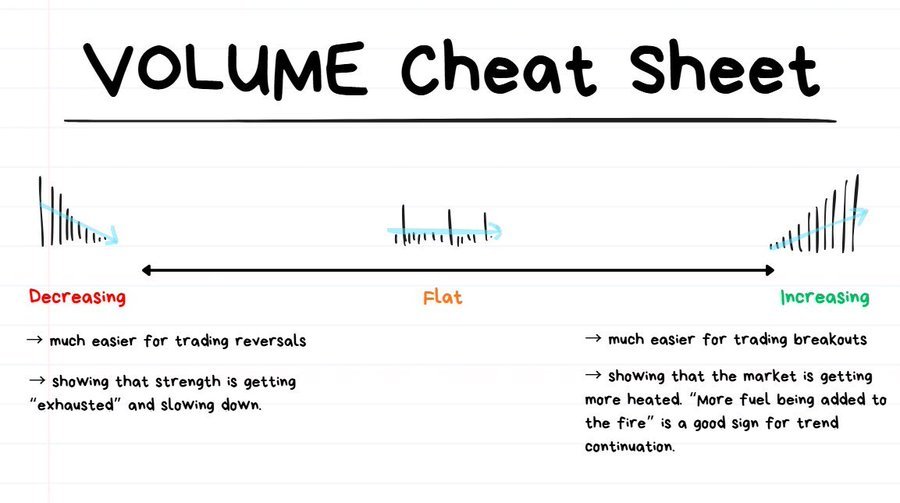
As explained in this Volume Masterclass, consistently increasing volume is good for momentum trades (breakouts) but unfavorable for mean reversion trades (reversals).
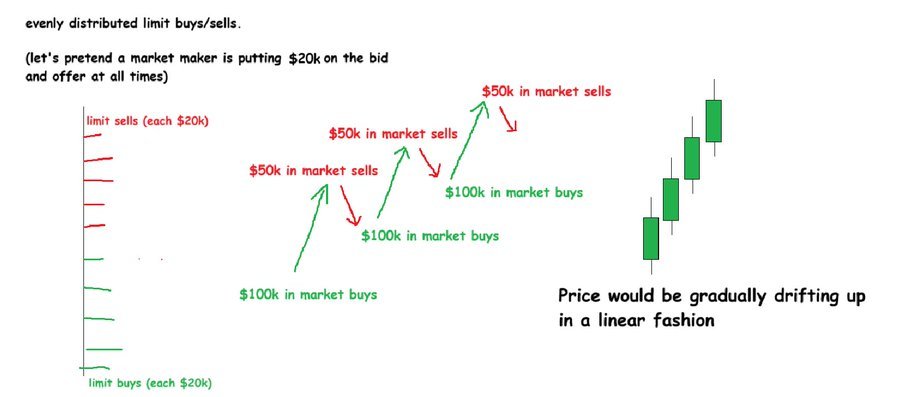
As explained in this Volume Masterclass, imagine that on the first 1-minute candle there are $100K in market buys and $50K in market sells, with an evenly distributed order book of limit buys and sells. If this exact flow continued for the next 60 candles without any change, the price would gradually drift upward, creating linear price growth.
The volume in this example would be $150K in every candle.
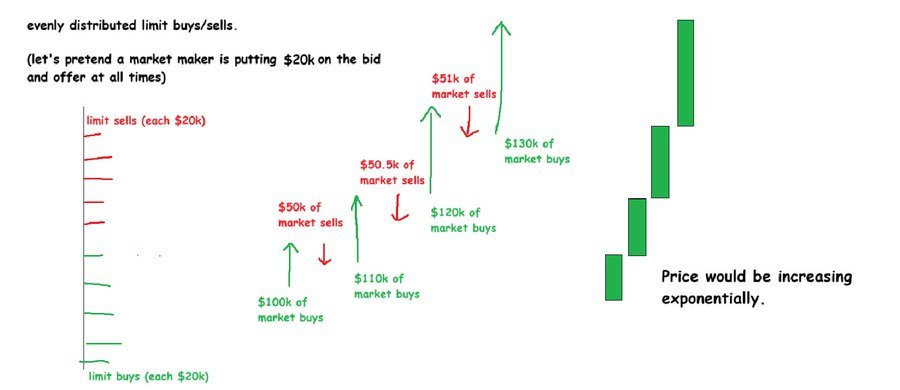
As explained in this Volume Masterclass, imagine that market sell volume increases by 1% on each subsequent candle, while market buy volume increases by 10%. If this pattern continues consistently for 60 candles, buying pressure will gradually dominate and push price higher.
Let’s also assume that the limit buy/sells are evenly distributed. Throughout those 60 candles, the size of the green candles would continue growing larger and larger. This would be exponential growth in price.
In a real trading environment the distribution of limit buys/sells and market buys/sells is always changing, but this concept still generally holds firm.
If you are entering a Momentum Trade (betting on the level to break), as long as there is no drastic change in the market conditions there will be an advantage with how price reacts to consistently increasing volume (especially if the market buys are increasing) .
🤓 NOTE TO READER: As discussed in this Volume Masterclass, if you use the TAPE (an aggregator of market orders across exchanges), here is a post I made that is highly relevant to this topic ↓
❗️TIP: There’s nothing “magical” with the Tape tool. It’s just a tool which makes Volume Data a little bit easier to visualize.
As explained in this Volume Masterclass, the reverse is also true. Decreasing volume is generally bad for breakout trades because fewer traders are participating, while it can be favorable for reversal setups.
If the volume is DECREASING after Traders have hit into a Breakout Trade, it means there are less and less people interested in the coin. This can cause the price to stall and naturally, out of impatience, some traders offload their position at breakeven.
Here’s a post below where I have tried my best to visualize this ↓
Below I want to show some examples to help with learning and understanding this concept.
🤓 NOTE TO READER: In this Volume Masterclass, I’m intentionally cherry-picking examples. The goal isn’t the trade result but how volume behaves relative to the trade style (momentum or mean reversion).
^increasing volume over time is generally good for continuation
As discussed in this Volume Masterclass, decreasing volume is ideal when trading reversals. However, if the price action becomes very choppy, flat volume conditions can still support a valid reversal setup.
After the big spike near 1:30 UTC, the volume gradually (and subtly) started decreasing.
If you were to look at the “slope” of the Moving Average on top of the volume (the blue colored line), observe but its steep slope upwards.
When this is paired with “slow grindy staircase” price action it’s often a great sign for continuation in that same direction.
After the big spike at 12:30 UTC the volume really started to dry out and rapidly decrease.
Once price finally got to the low of the day, there was a bit of a spike into it but price crawled back upwards shortly after.
This is definitely one of the more extreme examples due to how severely the volume was increasing during that uptrend.
I believe it’s important not to think in “binaries” but rather in “continuums”.
❗️TIP: The HIGHER THE INTENSITY of the volume increase = the STRONGER THE BREAKOUT
This is another example where the volume was really wildly increasing while being paired with a really strong trend.
❗️ TIP: As highlighted in this Volume Masterclass, shallow pullbacks during a trend often signal strong momentum. In contrast, deep pullbacks usually indicate that the trend is weakening.
The volume was increasing as PEPE was violently selling off but after that bit final drop anear 03:00 UTC, the volume started dying out and the price action started getting quite choppy.
Then finally there was a random spike out of nowhere into a level and the volume dried out again, which is generally a good sign for me to go for the reversal.
🤓 NOTE TO READER: As emphasized in this Volume Masterclass, the examples above highlight that increasing volume is generally better for breakout trades, while decreasing or flat volume is more favorable for reversal setups.
Reminder: Think in continuums, not binaries. The bigger the volume increase -> the stronger the breakout.
In this last lesson I want to include a bunch of resources which are relevant to how I use the volume indicator with my intraday trading.
Sometimes there is wash trading happening in a coin which causes it to meet the volume criteria despite the orderbook not being thick enough.
An immediate red flag is if there is a large price movement WITHOUT a corresponding volume spike that’s paired with it.
As explained in this Volume Masterclass, this is a red flag because if price travels a large distance with very little volume executed, a large trade in that market could result in significant slippage.
We really want to avoid losing unnecessary money to slippage at all costs so it’s just better to stay away from these coins.
Some context:
As mentioned earlier above in the article, increasing volume is a really great sign for Momentum because if the market conditions do not change, there is a really nice advantage to sitting in that trade because price can potentially go exponential.
However, as explained in this Volume Masterclass, if market conditions change, the trade should be abandoned as quickly as possible. One major signal of this change is when volume begins to drop sharply while you are still in an active position.
The sample size here is a bit low for this to really be considered “some real good juicy alpha” but I hope looking at these stats inspires you to do your own research on anomalies that can sometimes appear in the Volume.
It makes some logical sense that if you get a “big weird event” (it doesn’t have to just be volume anomalies, it can be anomalies in ANYTHING) happen in a coin, that you would also get “big weird price action” that follows.
Collecting the statistics on how many times that anomaly happened and if there are any recurring patterns that follow it can be quite helpful if you plan on Trading for a while.
If a coin is doing $10k/1min of volume and then suddenly it’s doing $1m/1min on average and CONSISTENTLY for several minutes in a row, this is a sign that BIG PLAYERS are entering this coin.
But it’s extremely rare for big players to start randomly throwing literal millions of dollars into an illiquid coin that was barely moving before, this often happens whenever there is some big news event related to that coin such as the Founder dumping his coins, the project getting hacked or some other big FUD.
I have found that if I can confirm that the news happens to be some kind of negative FUD that the coin really does feel like it’s on “easy mode” to play breakout shorts in.
So in summary here: if I see a huge and consistent increase in the volume I always make sure to double check if there’s any news.
1. Avoid Fake Liquidity
2. Early Exit on Volume Drop
3. Volume Spike Statistics
4. Check for News
👉 In short: Use volume to spot fake liquidity, detect early invalidation, study anomalies, and confirm news driven momentum.
Once again I would like to thank you for your time and attention as you pushed through this article.
I hope that Volume is no longer this random tool that sits at the bottom of your charts for no reason, but now is actually being put to use in your trades.


• Ex-Prop Trader • 9 Years Crypto • Get your free trading strategy guide 👇
https://t.co/MOTS6G6aJl


