Loading Ratings...

Discover how to use Momentum Indicators like RSI, MACD, OBV and other advanced concepts that help you in making better trading decisions
Author: Chirag Sharma
Published On: Sat, 07 Dec 2024 14:28:04 GMT
Momentum indicators are essential tools in the arsenal of a crypto trader. They help assess the speed and strength of price movements, offering insights into potential market reversals or continuations. By analyzing momentum, traders can identify opportunities to enter or exit positions more effectively. TradingView, a popular platform for charting and technical analysis, offers a comprehensive suite of momentum indicators to aid decision-making.
In this guide, we’ll delve into some of the most powerful momentum indicators for crypto trading, their functionalities, and how to use them effectively on TradingView.

Momentum indicators measure the rate at which an asset’s price changes over time. Unlike trend indicators that identify the overall direction of the market, momentum indicators focus on the intensity of the movement. They help traders understand whether a trend is likely to continue or weaken.
For instance, a sharp rise in momentum could signal strong buying pressure, while a decline might indicate weakening enthusiasm. These indicators are particularly useful in volatile markets like crypto, where prices can shift rapidly.
Momentum indicators typically oscillate within a defined range, making them valuable for spotting overbought and oversold conditions. This ability to gauge market strength can provide traders with a crucial edge when planning trades.
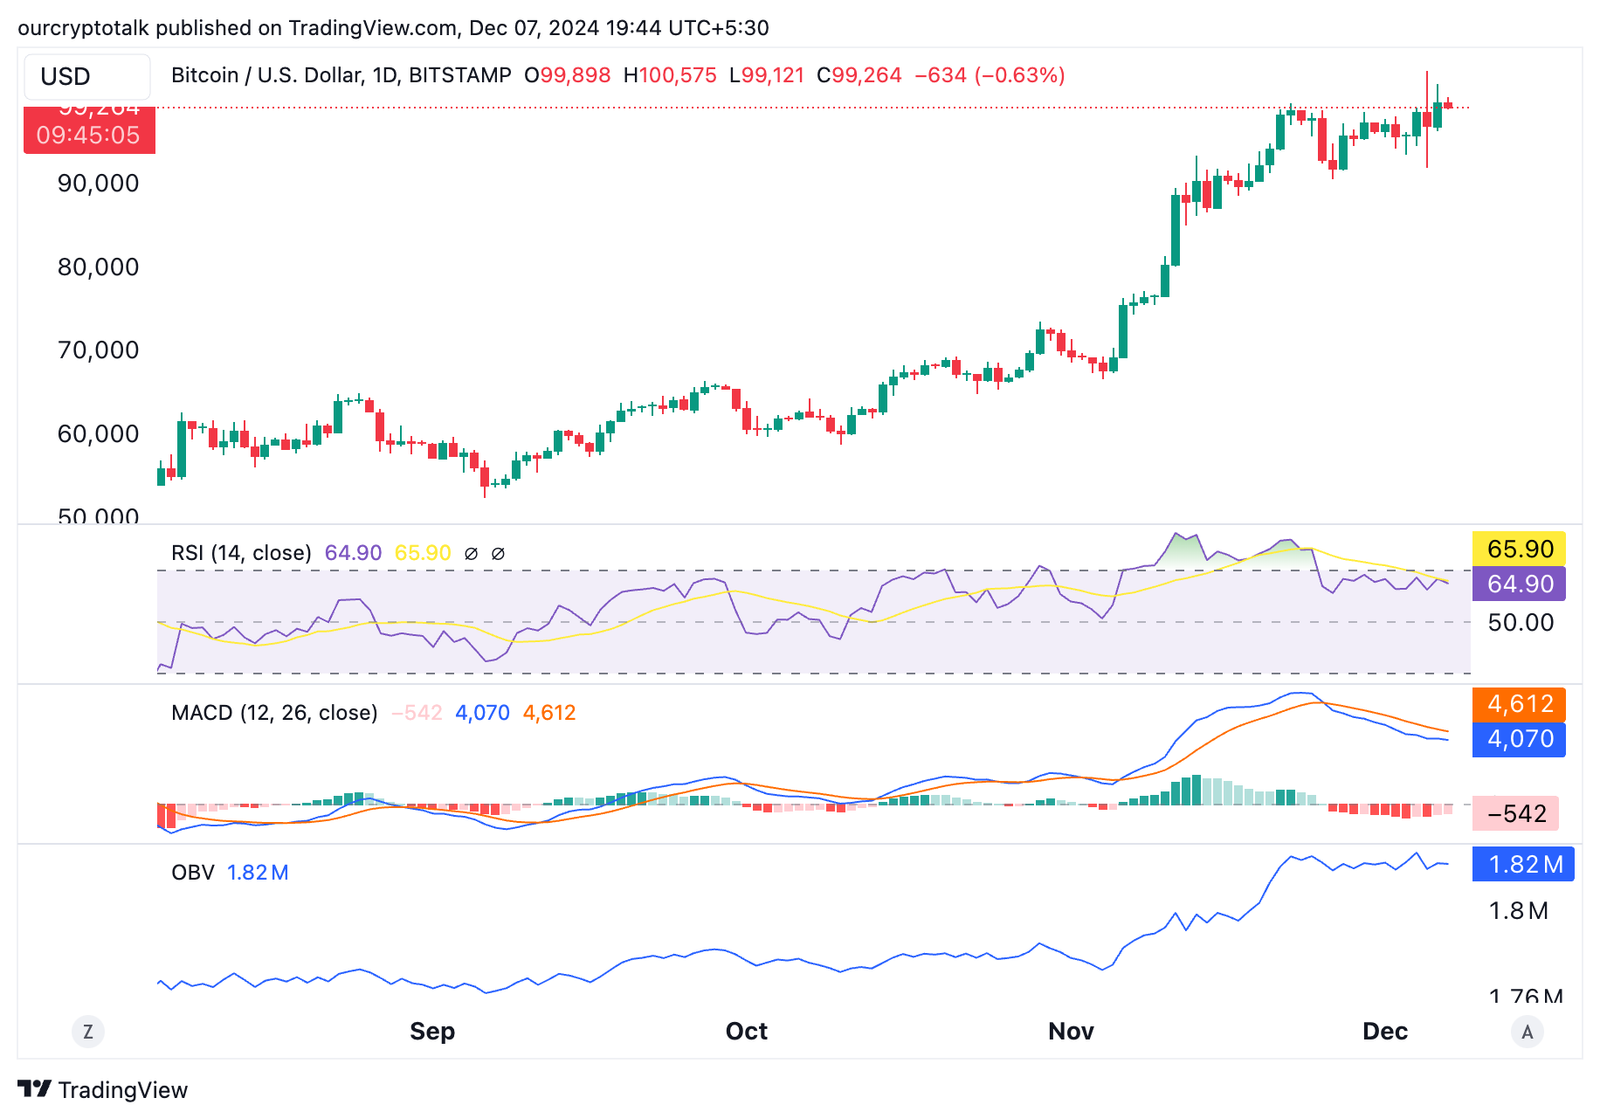
The Relative Strength Index (RSI) is one of the most widely used momentum indicators. Developed by J. Welles Wilder, RSI measures the magnitude of recent price changes to determine overbought or oversold conditions.
MACD is a dual-purpose indicator, acting as both a trend and momentum tool. It compares two moving averages (usually the 12-day and 26-day EMA) to identify changes in momentum.
On-Balance Volume (OBV) is a unique momentum indicator that links price movements to trading volume. It assumes that volume precedes price, making it a leading indicator.
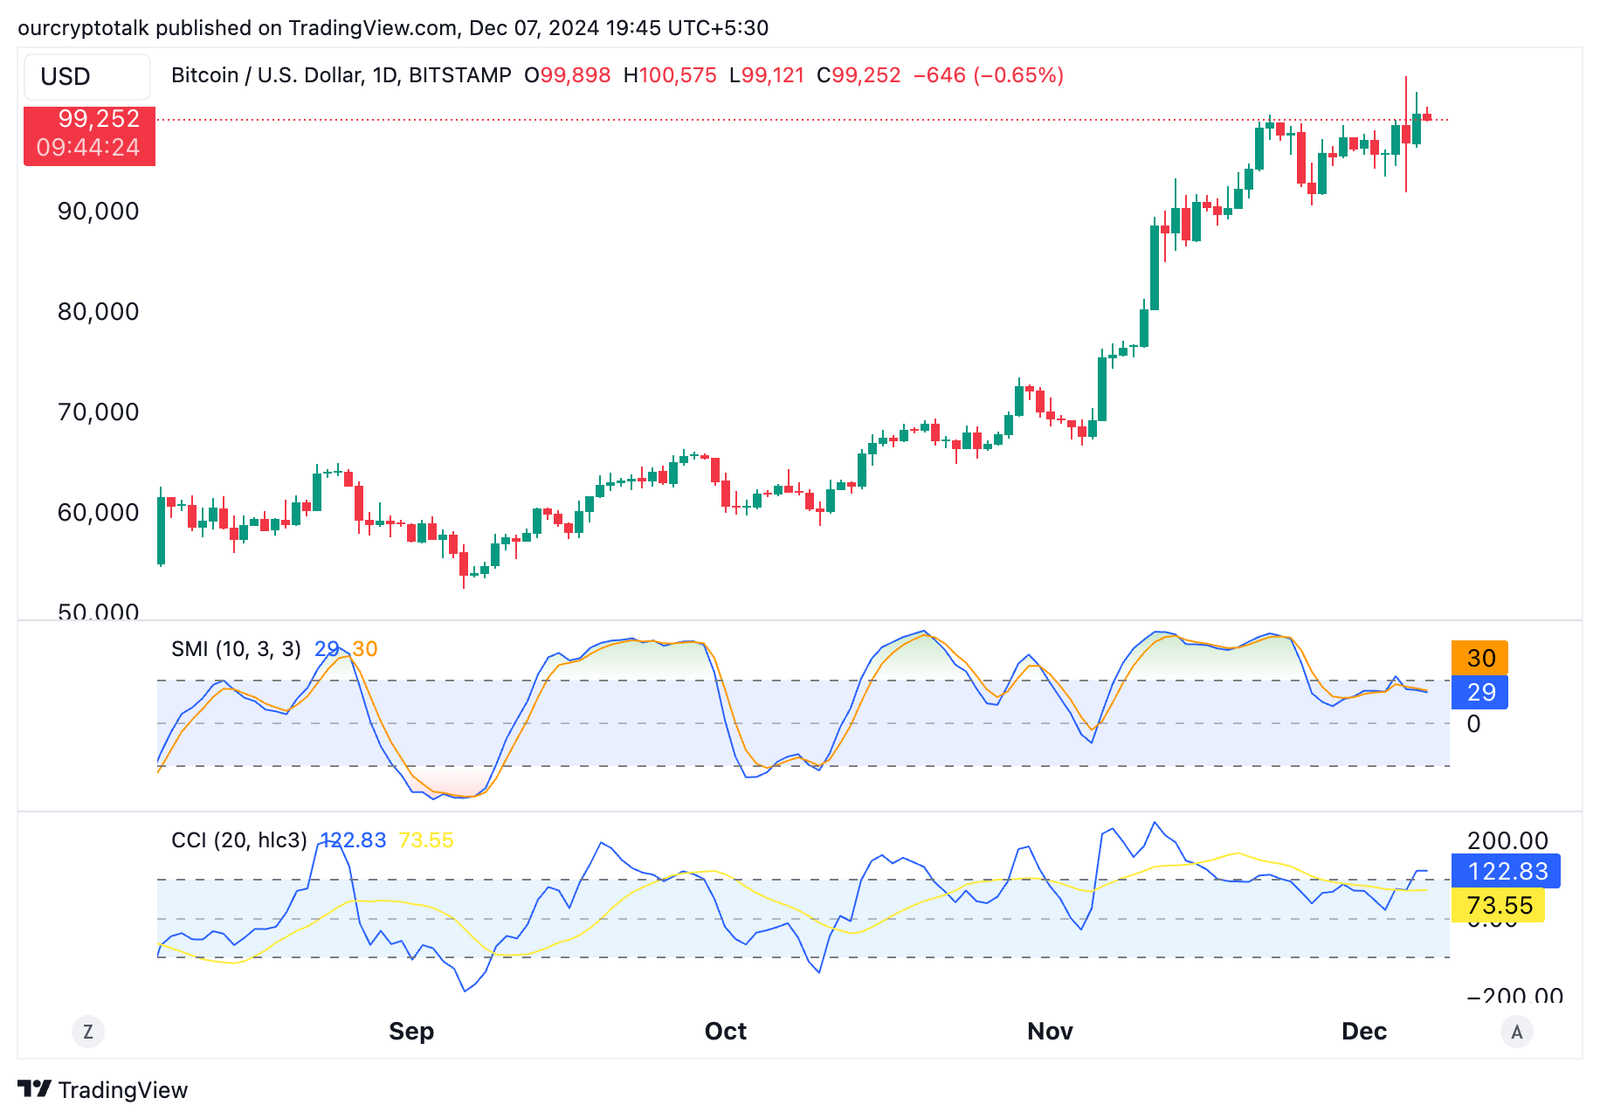
The stochastic oscillator is another popular tool for momentum analysis. It compares an asset’s closing price to its price range over a specified period.
The Commodity Channel Index (CCI) is a versatile momentum indicator that measures deviations from the average price. It’s not limited to commodities and works well for crypto trading too.
This simple indicator directly measures the rate of price change over time.
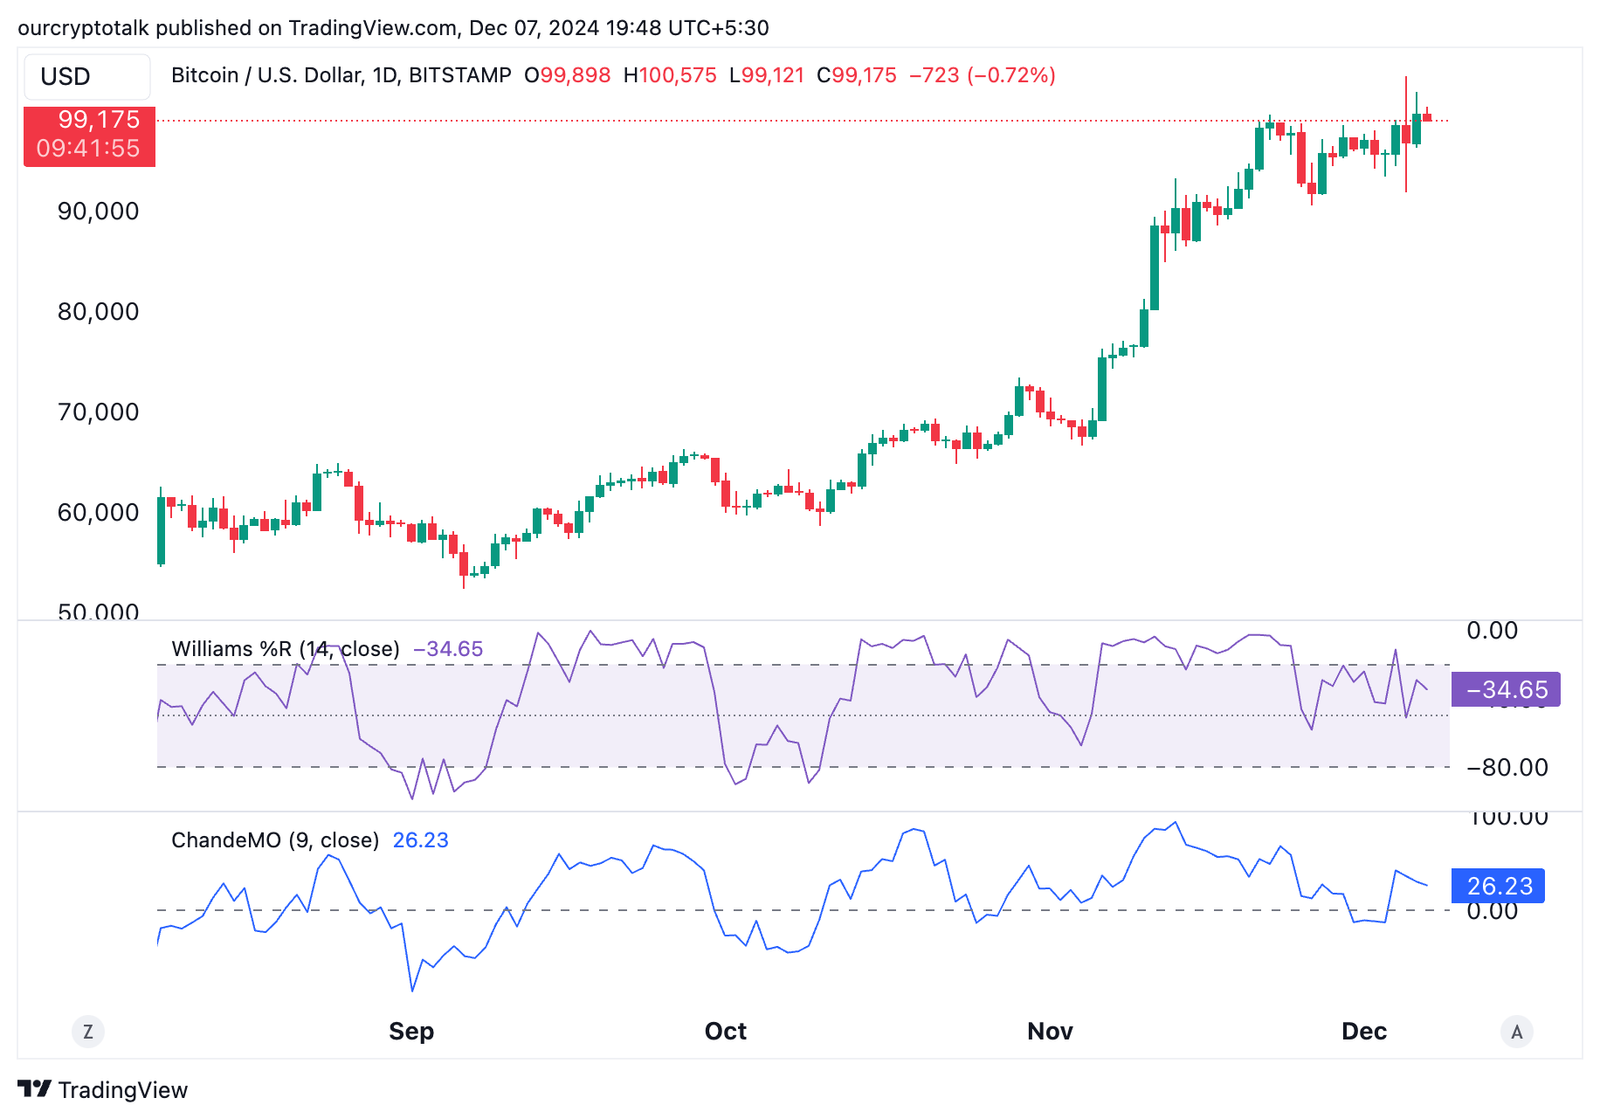
Williams %R is similar to the stochastic oscillator but with reversed scaling. It identifies overbought and oversold levels.
The CMO is a lesser-known indicator that refines traditional momentum calculations. It focuses on the sum of gains and losses over a period.
Momentum indicators are powerful tools, but they work best when combined with other types of analysis. For example:
Momentum indicators excel in capturing the speed and strength of price movements, but they shouldn’t be used in isolation. Unlike trend indicators, which focus on direction, momentum indicators highlight the intensity of the move. Combining these tools can create a more robust trading strategy.
While momentum indicators are powerful tools, they come with certain challenges. Understanding these limitations is crucial for effective trading:
Some momentum indicators, like MACD, rely on moving averages, which inherently lag behind price action. This can lead to delayed signals, especially in fast-moving markets like crypto.
During periods of low volatility, momentum indicators can generate false signals, leading traders to enter or exit positions prematurely.
Default settings may not suit all trading styles or market conditions. For instance, a 14-period RSI might work well in trending markets but may be less effective in ranging markets.
Momentum indicators analyze historical price data but cannot account for fundamental events like regulatory announcements or major news affecting crypto prices.
Momentum indicators are most effective when used strategically. Here are some best practices to maximize their utility:
Using a single indicator can sometimes give misleading signals. Combining two or more momentum indicators, like RSI and MACD, provides more reliable insights.
Analyzing momentum on different timeframes helps traders align short-term signals with the broader market trend.
TradingView offers customizable alerts that notify traders when momentum indicators reach specific thresholds. This ensures you don’t miss critical trading opportunities.
Volume can act as a complementary indicator to momentum. For example, a bullish momentum signal with increasing volume strengthens the case for a price rise.
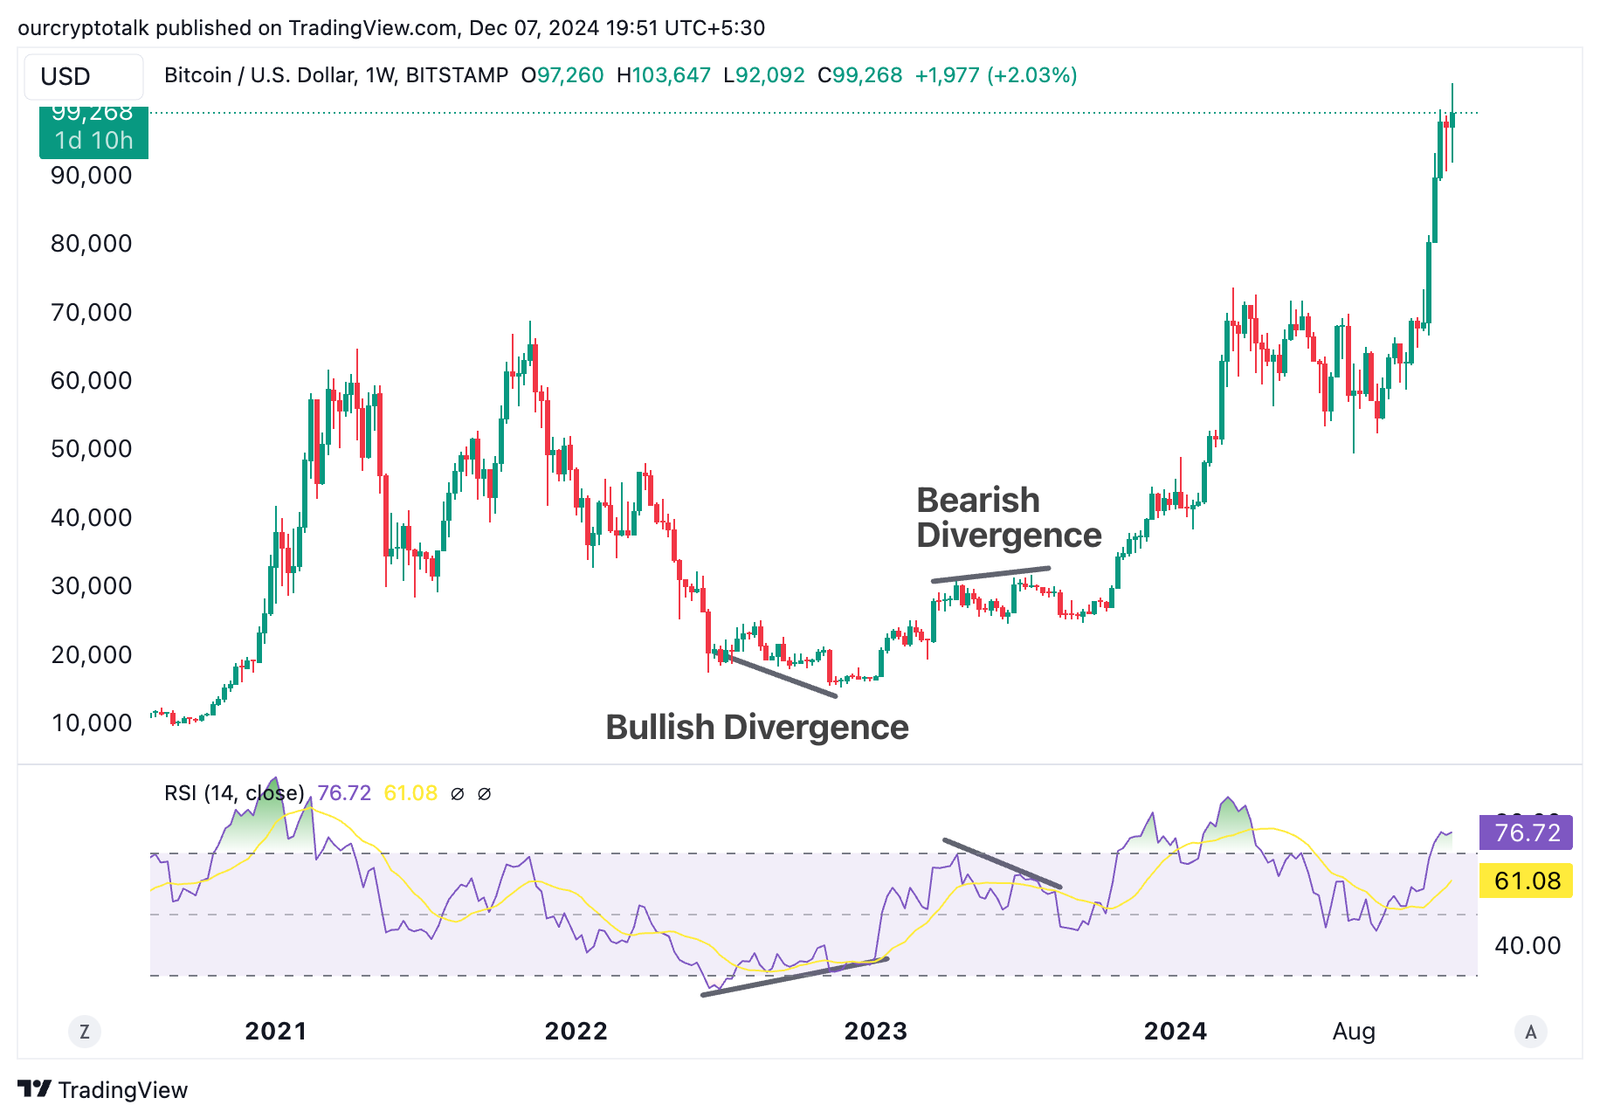
Divergences occur when the price moves in the opposite direction of a momentum indicator. These are strong signals of potential reversals.
Momentum indicators can confirm the strength of a breakout from key levels like support or resistance.
While overbought conditions may indicate a reversal, they can also signal the continuation of a strong trend. Understanding context is essential.
Momentum indicators are valuable tools, but improper use can lead to significant losses or missed opportunities. To maximize their potential, it’s crucial to understand and avoid common mistakes:
Relying solely on one momentum indicator, such as RSI or MACD, can be misleading. Indicators work best in combination with others and with broader technical and fundamental analysis. For example, while RSI might show overbought conditions, price action could still move higher due to strong market sentiment.
Momentum indicators provide data based on past price movements, which may not reflect sudden market shifts. Ignoring news events, global economic conditions, or changes in regulatory landscapes can render these tools ineffective. For instance, a bullish MACD crossover may seem promising, but a new regulatory ban could cause unexpected sell-offs.
Indicators like RSI and MACD are used to spot divergences, but traders often misread them. A bearish divergence might signal weakening momentum, but it doesn’t guarantee an immediate price drop. Misinterpreting such signals can result in premature exits or entries.
Momentum indicators behave differently across various timeframes. Using a short-term timeframe for long-term trading or vice versa can lead to inaccurate readings. Day traders should focus on 1-minute to 15-minute charts, while swing traders might benefit from daily or weekly charts.
Volume plays a critical role in validating momentum. Indicators like OBV (On-Balance Volume) are designed to incorporate volume, but neglecting it alongside others can lead to false signals. For example, a price increase with low volume might indicate weak market interest, making the trend unsustainable.
Momentum indicators frequently generate signals, but not all are actionable. Overtrading by reacting to every crossover or divergence can result in excessive transaction costs and losses. Patience and filtering for high-probability setups are key.
No indicator is foolproof. Entering trades without setting stop-losses or overleveraging based on indicator signals is a common pitfall. Even if a momentum indicator suggests strong movement, unexpected market shifts can occur.
Indicators like RSI often come with default settings (e.g., 14-period). While these work for many scenarios, adapting settings to specific market conditions or personal strategies can improve results.
A trader notices Bitcoin’s RSI reaching 80, indicating overbought conditions. While the trader considers selling, they also analyze the broader trend and realize Bitcoin is in a strong bull run. Instead of exiting entirely, they decide to scale out, locking in partial profits while letting the rest ride the trend.
During a bear market, Ethereum shows a MACD bullish crossover on the daily chart. The trader enters a long position but sets a tight stop-loss below the recent support level. As the MACD signal strengthens and Ethereum rises, the trader gradually adjusts the stop-loss to protect gains.
A trader sees Cardano (ADA) break a resistance level. To confirm the breakout, they check OBV, which shows a significant volume increase. Confident in the momentum, the trader opens a long position, which later yields substantial profits as ADA surges further.
In a sideways market, XRP’s price forms higher highs, but RSI shows lower highs, signaling bearish divergence. The trader anticipates a potential reversal and avoids entering a long position. Shortly after, XRP drops, validating the divergence signal.
A trader uses MACD for entry signals and RSI for overbought/oversold confirmation. When Litecoin shows a MACD bullish crossover and RSI near 30, the trader enters a long position. As the trade progresses and RSI approaches 70, they exit, capturing profits before a pullback occurs.
These examples highlight the practical application of momentum indicators when combined with market context, risk management, and complementary tools.
Momentum indicators are invaluable tools in the arsenal of crypto traders, offering insights into the strength and direction of price trends. By analyzing past price movements, these indicators help traders make more informed decisions about when to enter or exit trades. Tools like the RSI, MACD, and OBV provide actionable data, such as identifying overbought or oversold conditions, confirming trends, or spotting potential reversals. Their application isn’t limited to just spotting entry and exit points; they also offer broader insights into market sentiment and behavior, enabling traders to adjust their strategies accordingly.
However, it’s essential to recognize that no single indicator can guarantee success. Crypto markets are inherently volatile and influenced by various factors, including market sentiment, global events, and technological advancements. Momentum indicators, while powerful, should always be used alongside other analytical tools and fundamental research. Incorporating volume analysis, support and resistance levels, and trend lines can provide a more comprehensive view of the market.
Traders must also tailor their use of momentum indicators to their trading style. Day traders, for instance, might rely on shorter timeframes and quicker signals, while swing traders may focus on longer-term trends. Understanding the nuances of each indicator and adjusting their parameters for specific market conditions can enhance their effectiveness.
Risk management is another critical aspect of using momentum indicators effectively. Setting stop-loss levels, avoiding overleveraging, and maintaining a disciplined approach can help mitigate potential losses. Emotional trading and overreliance on any one tool can lead to mistakes, so maintaining a balanced perspective is crucial.
In conclusion, momentum indicators are a powerful resource for traders aiming to navigate the complexities of the crypto market. When used wisely and in conjunction with other strategies, they can significantly improve trading outcomes. Yet, their effectiveness ultimately depends on the trader’s ability to interpret them correctly and act with discipline and foresight. By combining technical analysis with a robust trading plan and risk management practices, traders can maximize the benefits of momentum indicators and thrive in the ever-evolving crypto landscape.
No indicator guarantees success; use them as part of a broader trading strategy.
Momentum indicators measure the strength and direction of price movements to help traders make informed decisions.
Tools like RSI, MACD, and OBV are essential for spotting overbought/oversold conditions and trend reversals.
Combine momentum indicators with other tools like volume analysis, support/resistance, and trend lines for a holistic approach.
Tailor indicator settings to match your trading style and market conditions for optimal results.
Effective risk management, including stop-losses and avoiding emotional trading, is crucial for success.
Real voices. Real reactions.


