Loading Search...

An in-depth analysis of the Great Crypto Crash of 2026, examining causes, RSI signals, liquidation cascades and historical parallels.
Author: Tanishq Bodh
By early February 2026, the crypto market is no longer correcting. It is breaking. Bitcoin trades in the $63,000 to $65,000 range, down nearly 50 percent from its October 2025 all-time high near $126,000. Ethereum has slipped below $1,900. Large-cap altcoins such as Solana, XRP, and BNB have recorded double-digit daily losses. Smaller tokens are down 20 to 30 percent in days. We’re seeing crypto crash again.
This is not a routine pullback. It is a systemic reset that has erased trillions of dollars in market value and forced investors to confront uncomfortable questions about leverage, liquidity, and macro alignment.
Crypto has experienced crashes before. Each felt terminal in the moment. Each eventually gave way to recovery. The difference in 2026 is scale. This drawdown arrives after institutional adoption, ETF flows, and political optimism had already pushed the market into a new regime.
Understanding what broke, and why it broke now, matters more than predicting the exact bottom.
The numbers tell a brutal story.
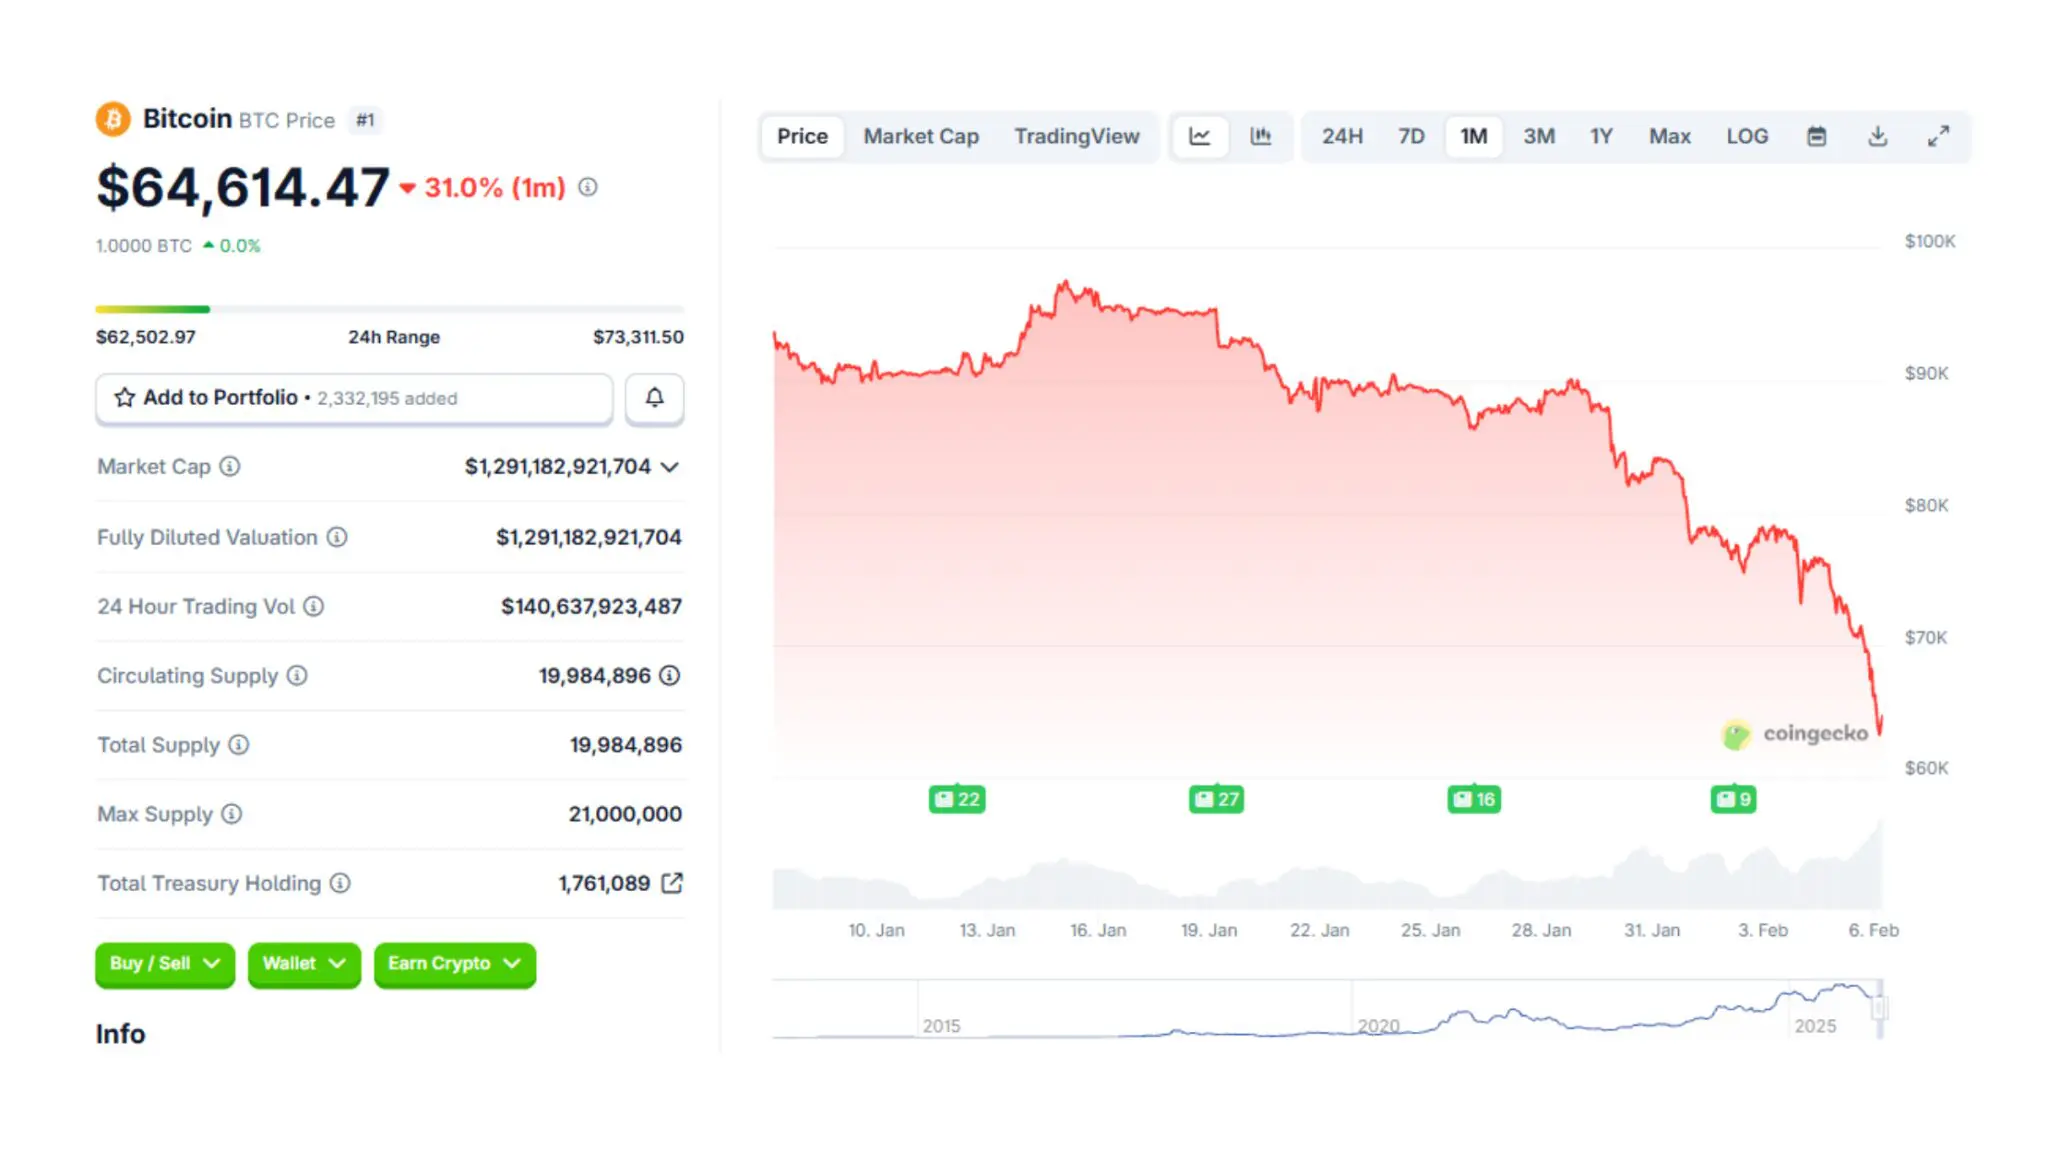
Total crypto market capitalization has fallen from over $4 trillion at the 2025 peak to roughly $2.2 to $2.5 trillion. In several 24-hour periods, major assets dropped between 11 and 13 percent. Over $1 billion to $2.5 billion in leveraged positions were liquidated during peak volatility, largely from overexposed long positions.
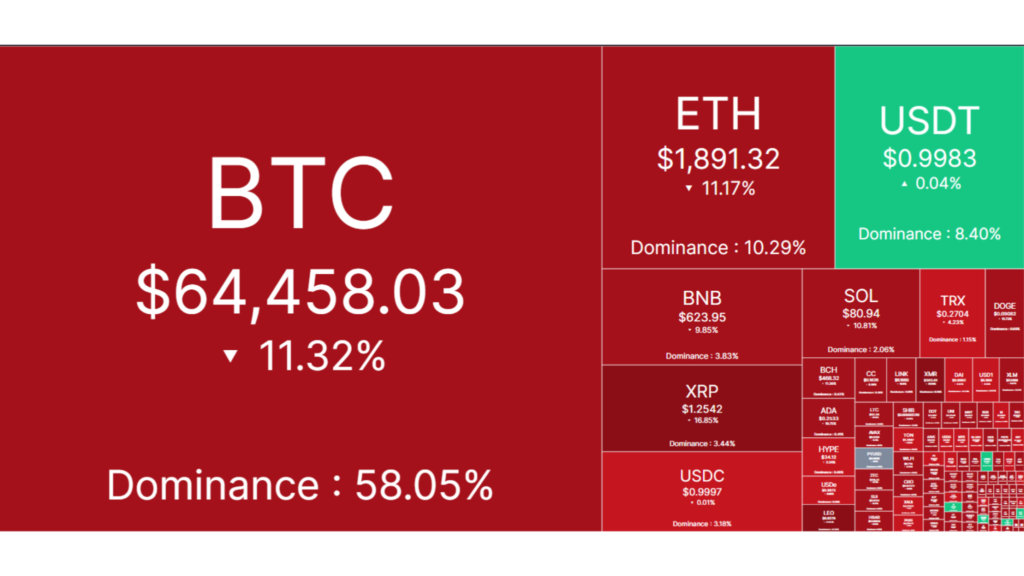
Bitcoin lost the $70,000 support level decisively and briefly traded near $62,500 before stabilizing. Ethereum reached its lowest level since mid-2025. Solana tested the $90 range. XRP declined more than 20 percent in a single session. Binance’s BNB fell over 13 percent, reflecting pressure across centralized and decentralized venues.
Market sentiment confirms the damage. The Crypto Fear and Greed Index has remained between 12 and 20, deep in extreme fear territory. These levels were last seen during the 2022 FTX collapse and the March 2020 COVID panic.
Liquidity has thinned significantly. Trading volume has surged past $200 billion, but the flow is dominated by forced selling rather than accumulation. Weekend liquidity gaps have amplified volatility, allowing large orders to move prices aggressively.
This is the fastest drawdown Bitcoin has experienced since November 2022. The speed matters because it accelerates psychological capitulation.
Institutions are not insulated from this move.
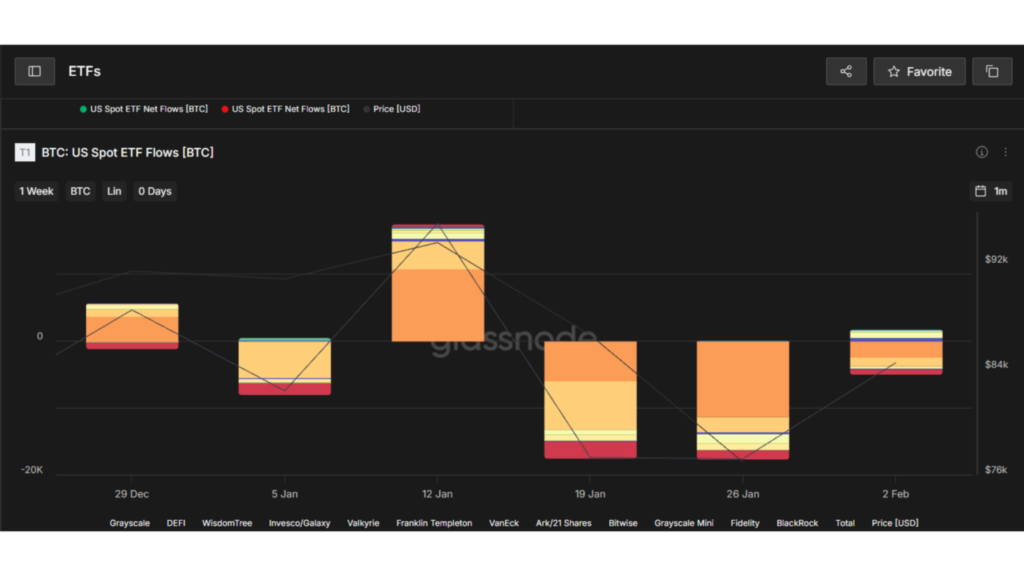
Public companies holding Bitcoin as treasury assets now sit billions underwater. MicroStrategy’s average cost basis near $76,000 places it under immediate pressure. U.S. spot Bitcoin ETFs, which fueled much of the 2025 rally, recorded net outflows exceeding $500 million in a single day.
Correlated assets are also under stress. Technology equities have sold off sharply. Traditional hedges like gold have shown instability. The idea that crypto had decoupled from macro risk has been disproven again.
This matters because the 2025 rally was driven by institutional flows. When those flows reverse, the impact is amplified.
This crypto crash did not appear overnight.
The first structural fracture occurred in October 2025, when a record liquidation cascade exceeding $19 billion exposed excessive leverage across perpetual futures markets. Since then, confidence eroded steadily. By late January 2026, an additional $10 billion in liquidations had occurred.
Market depth has declined roughly 30 percent from peak levels. Thin order books make price discovery violent rather than gradual. Once key support levels break, there are fewer natural buyers.
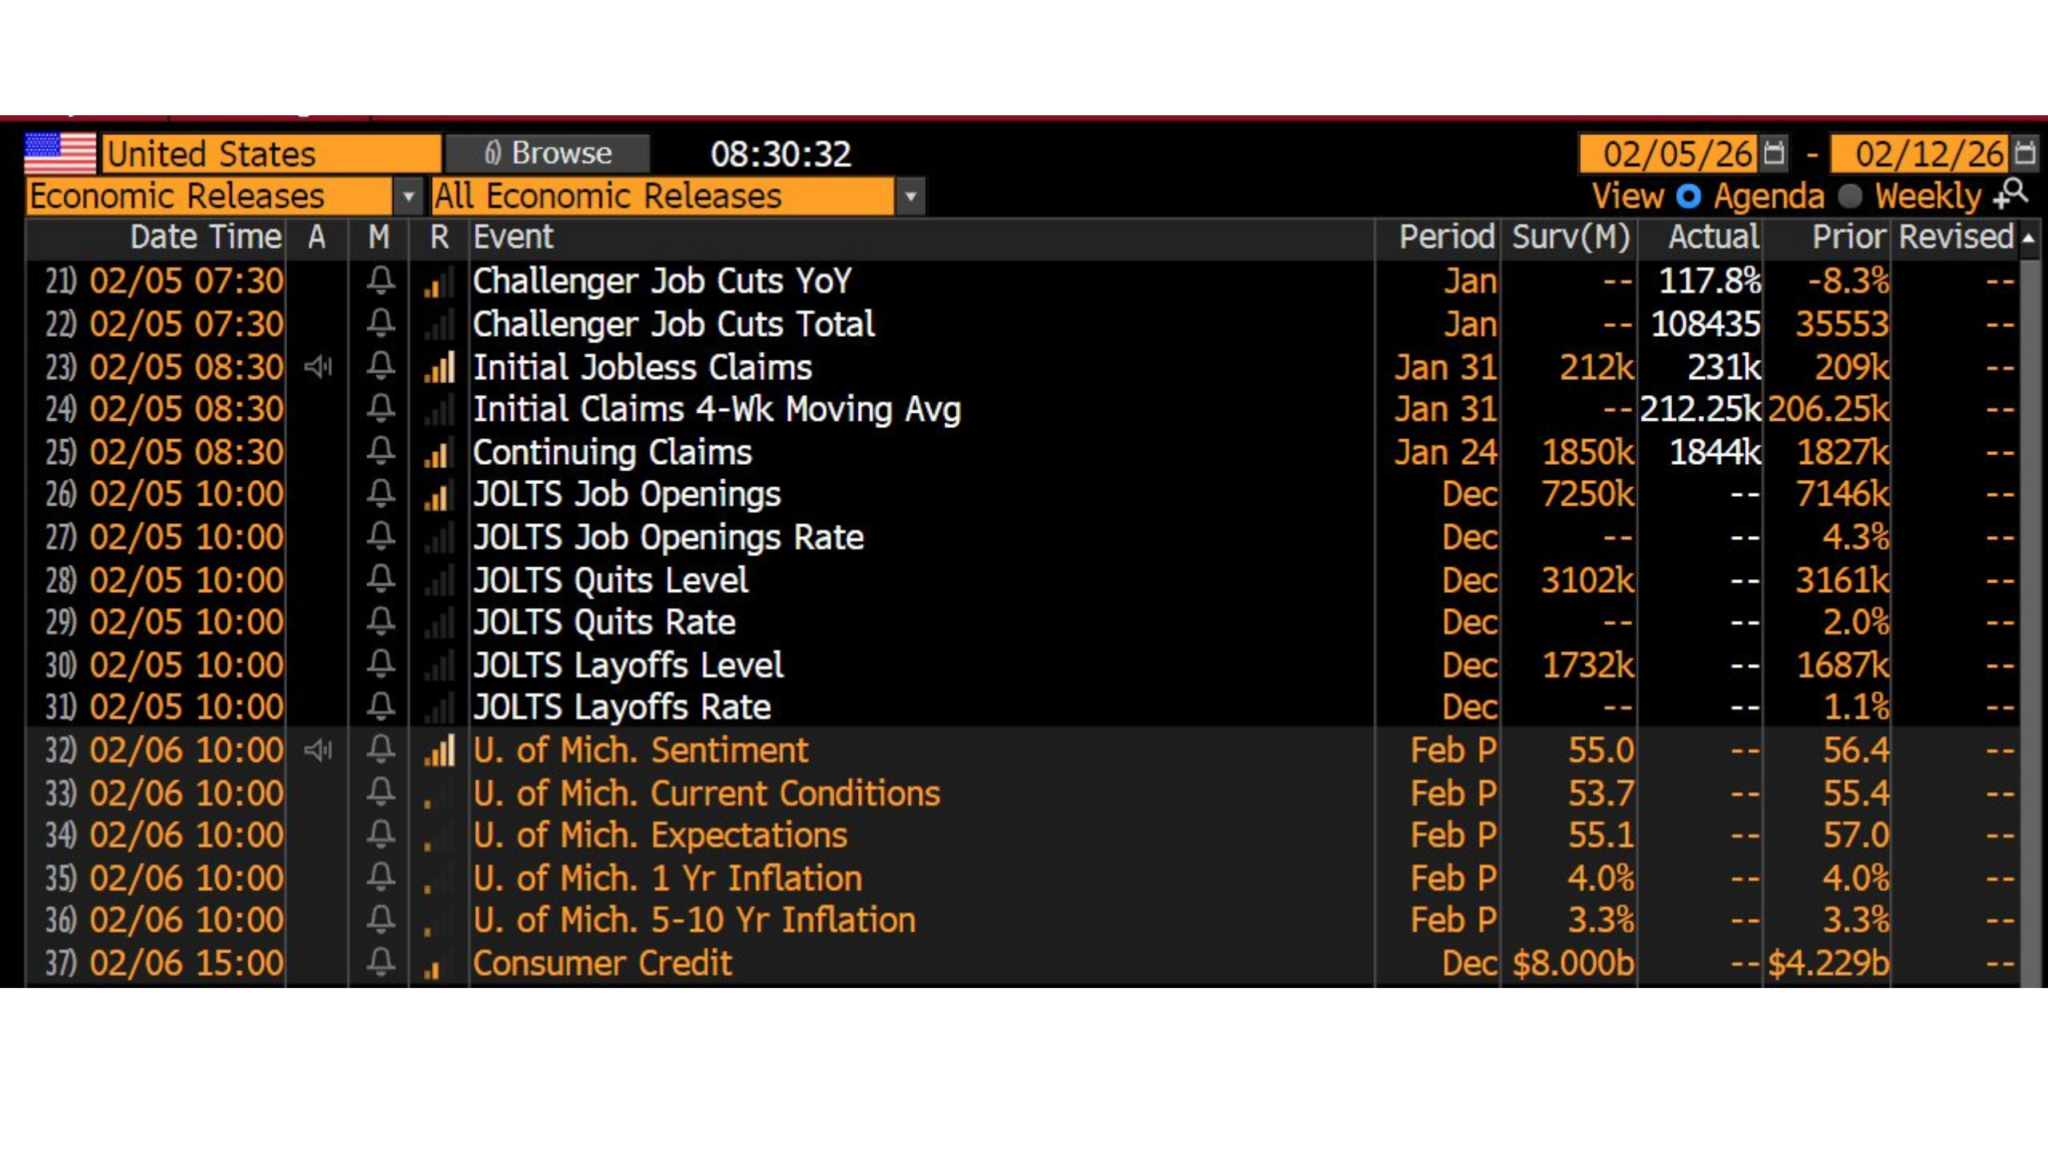
Macro conditions worsened the situation. Weak U.S. employment data raised fears of economic slowdown. Inflation remained sticky, keeping the Federal Reserve in a restrictive posture. Speculation around changes in Fed leadership introduced further uncertainty. A strengthening U.S. dollar reduced appetite for risk assets globally.
Geopolitical tension added pressure. Rising conflict risks pushed investors toward perceived safety, even as traditional safe havens showed stress.
Within crypto itself, leverage was the accelerant. Thin liquidity combined with large directional bets created a feedback loop. Selling triggered liquidations. Liquidations triggered more selling. This cycle continued until even long-term holders began to capitulate.
At this stage, the market is no longer reacting to news. It is reacting to its own structure.
When price action feels chaotic, technical indicators help separate emotion from structure. Right now, those indicators are flashing extreme stress.
Bitcoin’s daily 14-period Relative Strength Index has fallen into the 17 to 18 range. That places it among the most oversold readings in Bitcoin’s history. Only two moments were more extreme: the 2018 bear market bottom and the March 2020 COVID crypto crash. Weekly RSI sits near 29, while lower timeframes remain deeply compressed.
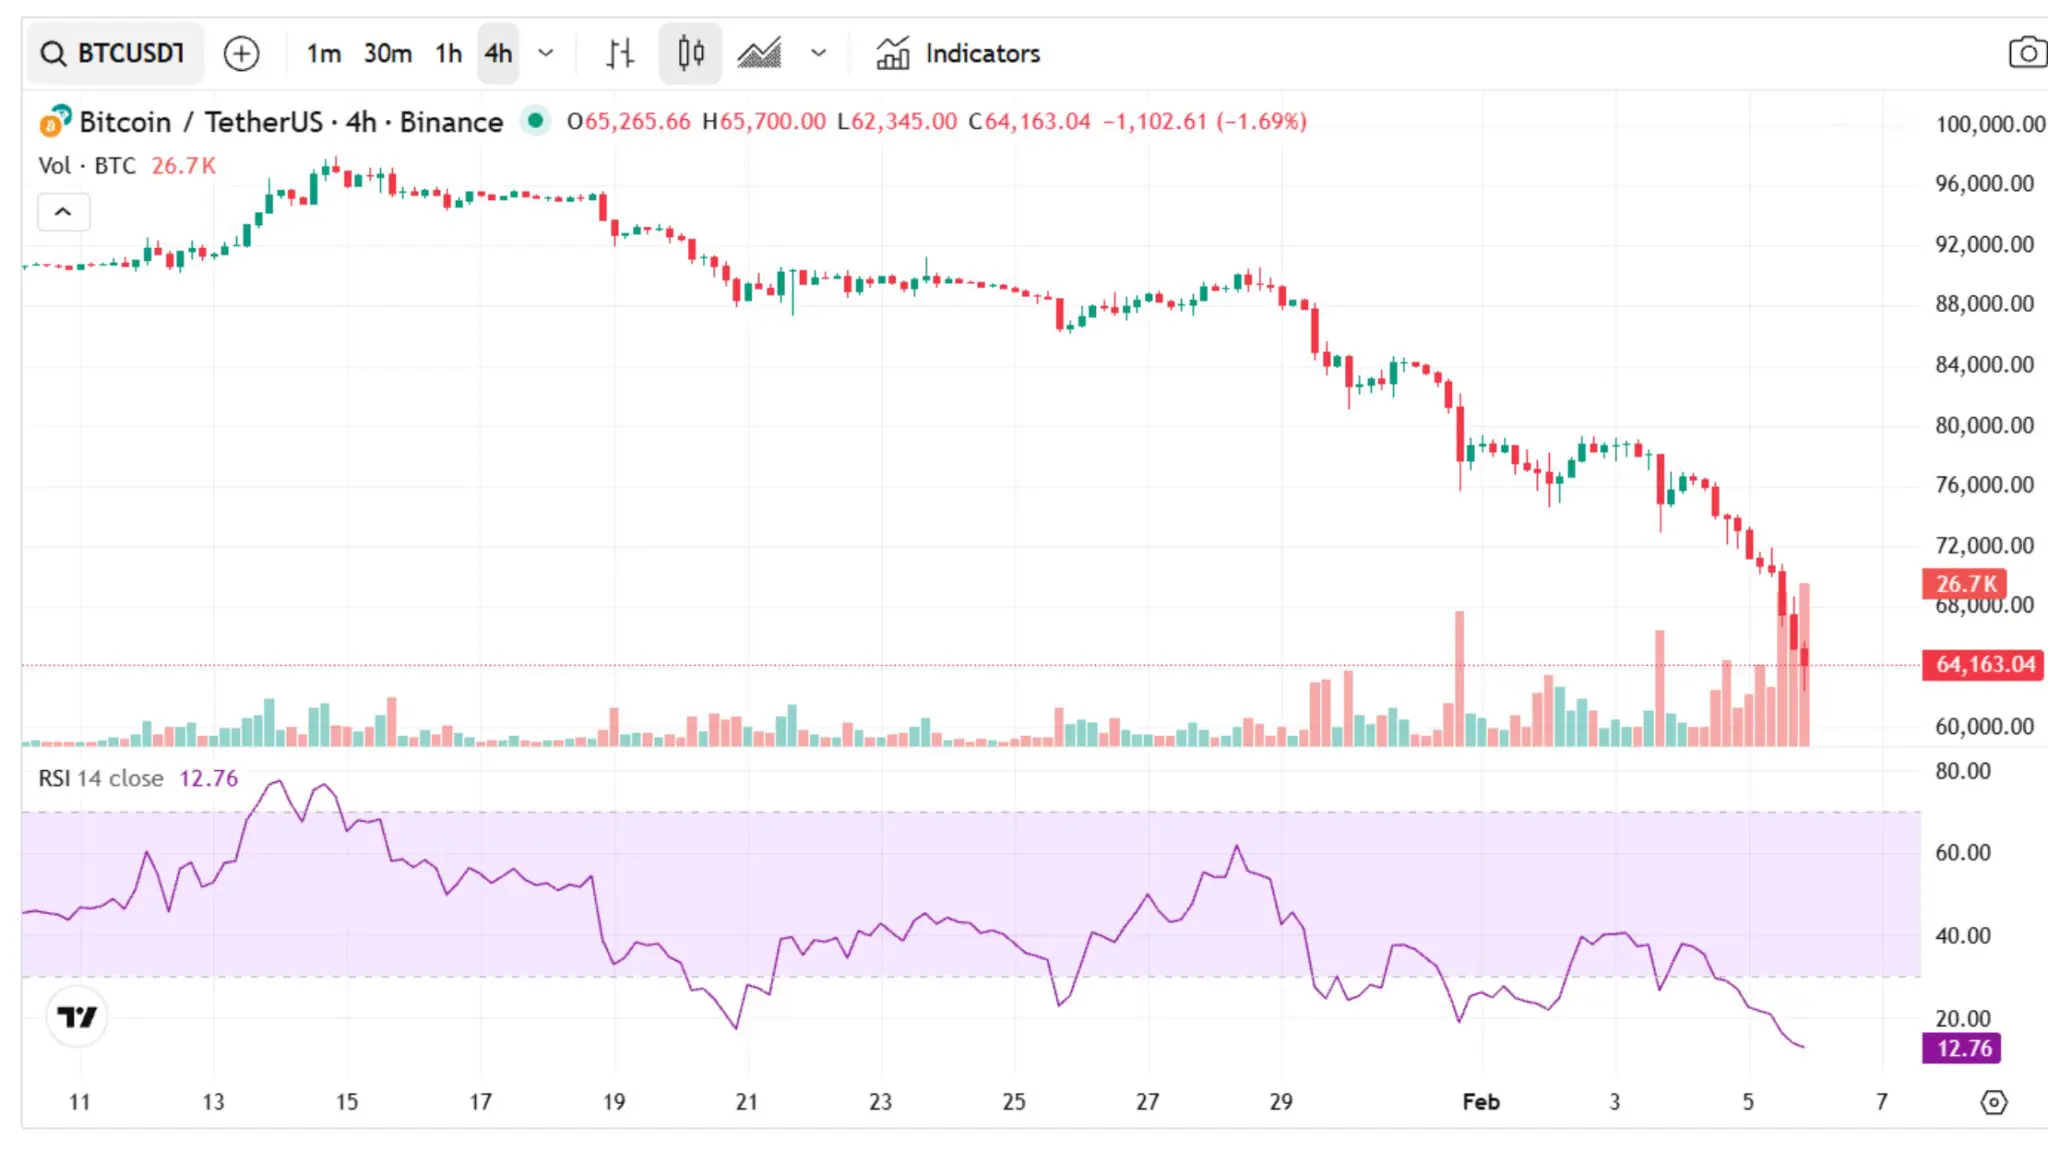
RSI measures momentum, not value. When readings drop this low, it signals seller exhaustion rather than guaranteed reversal. In other words, it suggests that most participants who wanted to sell have already done so.
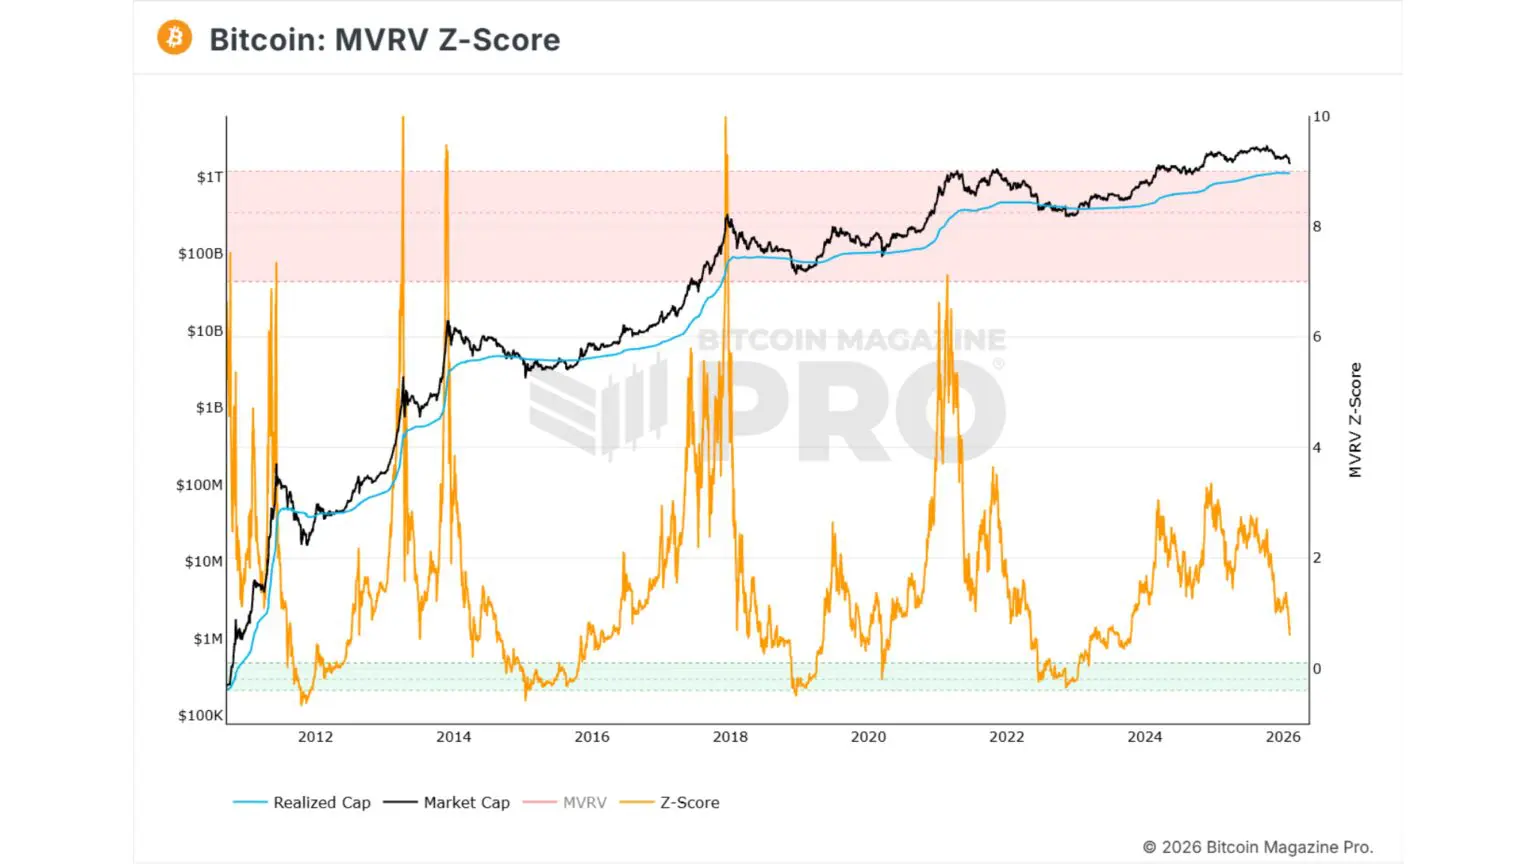
Other indicators support this view. The MVRV Z-Score, which compares market value to realized value adjusted for volatility, has moved into historically depressed territory. Large portions of circulating supply are now held at unrealized losses. Exchange reserves are declining slowly, suggesting early accumulation rather than panic inflows.
The 200-day moving average sits between $60,000 and $68,000. This zone matters. Holding above it historically signals long-term trend survival. Losing it increases the probability of a deeper reset toward prior cycle supports.
These indicators do not mark bottoms precisely. They mark conditions. In past cycles, similar readings preceded violent relief rallies followed by consolidation. The market is structurally stretched, but patience is still required.
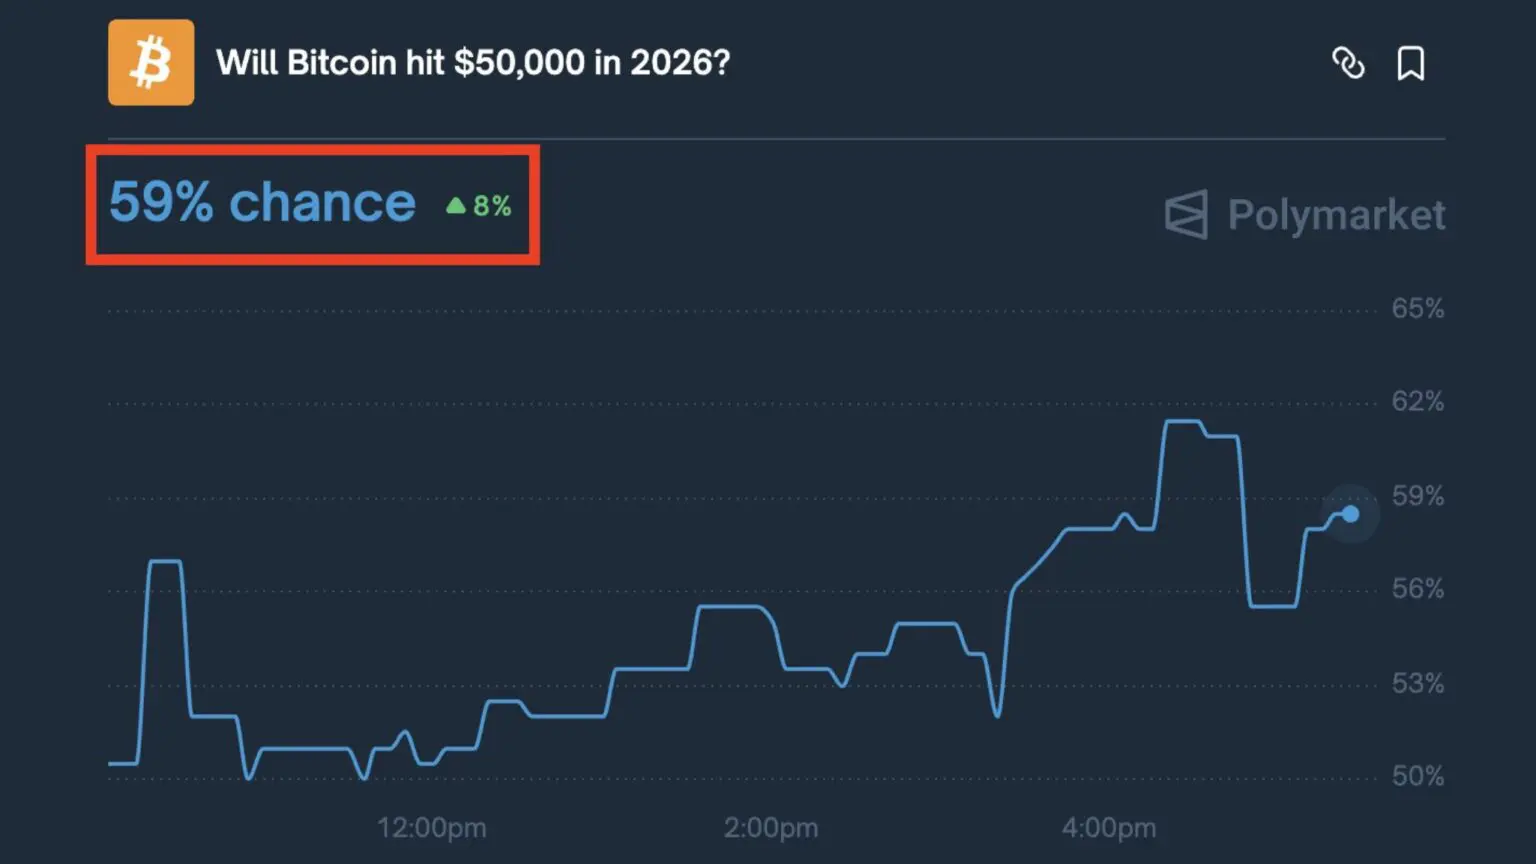
When narratives fragment, prediction markets offer a probabilistic lens.
On decentralized platforms like Polymarket, traders are pricing a 22 percent probability that Bitcoin falls below $30,000 in 2026. That outcome is not dismissed, but it is not the base case. More immediate bets reflect caution rather than collapse.
There is a strong probability assigned to Bitcoin testing below $60,000 in February. Odds decrease meaningfully below $50,000. End-of-year pricing suggests expectations of stagnation rather than explosive recovery.
What stands out is balance. Traders are not betting on systemic failure. They are betting on time. Sideways movement, volatility, and delayed recovery dominate probabilities.
That aligns with on-chain behavior. Capital is not fleeing crypto entirely. It is waiting.
Every major crypto crash feels unprecedented. Every one ends up rhyming with the past.
In March 2020, Bitcoin dropped nearly 50 percent in days as global markets panicked. RSI collapsed. Liquidations cascaded. Confidence evaporated. Within twelve months, Bitcoin had risen more than sixteen-fold.
In 2018, Bitcoin lost over 80 percent of its value. The market declared crypto finished. Development continued quietly. The next cycle delivered multi-thousand percent gains.
In 2022, the FTX collapse wiped out trust, liquidity, and leverage simultaneously. Recovery took longer, but it came through infrastructure maturation, regulatory clarity, and institutional entry.
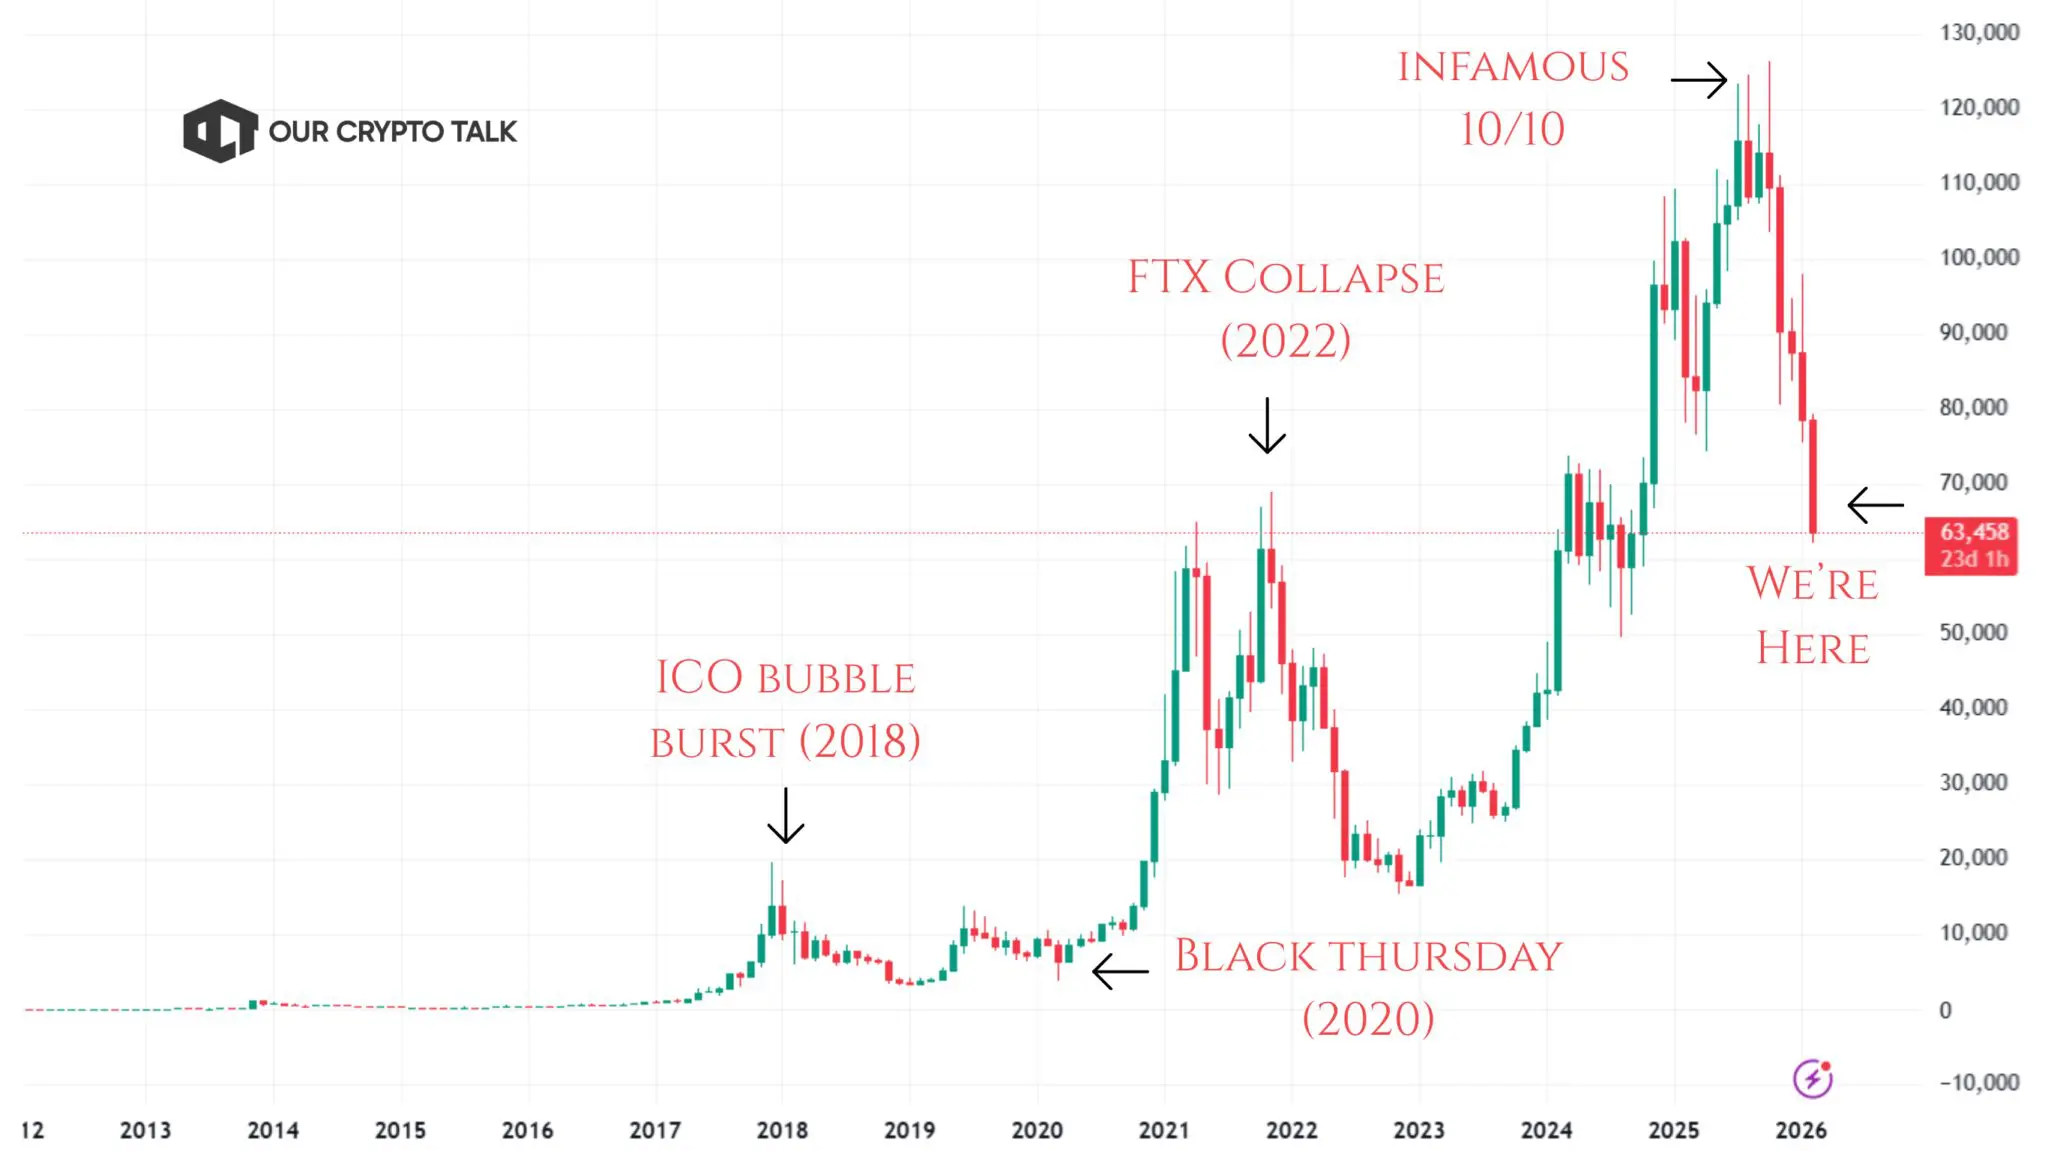
The 2026 crypto crash shares traits with all three. The magnitude matches 2020. The leverage resembles 2022. The sentiment mirrors 2018.
The key takeaway is not timing. It is durability. Crypto has never recovered quickly. It has always recovered structurally.
On social platforms, the tone has shifted from panic to fatigue.
Early crash phases are loud. This phase is quieter. Users discuss survival strategies rather than moon targets. Leverage is no longer celebrated. Risk management dominates conversation.
Veterans recognize the pattern. New participants feel betrayed. That divergence often marks late-stage drawdowns.
Importantly, engagement remains high. Developers keep shipping. Institutions have not exited entirely. The ecosystem is bruised, not abandoned.
This matters because true bottoms require apathy, not outrage. We are closer to that condition than most realize.
Markets bottom when three things align:
Price targets vary. Some models point to the low $60,000s. Others allow for deeper probes toward $50,000 or even $40,000. Precision matters less than behavior.
Recovery rarely starts with bullish news. It starts with selling failing to push price lower.
Catalysts do not need to be dramatic. A pause in rate tightening. ETF flow stabilization. Reduced liquidation volume. Regulatory clarity. Each removes pressure incrementally.
Historically, the strongest recoveries begin when nobody believes in them.
This phase rewards discipline, not bravado.
Dollar-cost averaging reduces emotional timing errors. Avoiding leverage preserves optionality. Diversifying across assets and time horizons lowers stress.
Most importantly, focus on fundamentals. Networks that continue to grow users, fees, and developer activity during drawdowns lead the next expansion.
Doing nothing is often the hardest but most effective strategy.
The Great Crypto Crash of 2026 feels severe because it follows legitimacy. This is not a fringe market anymore. Losses are real, public, and painful.
That is also why recovery matters.
Crypto has not been invalidated. It has been stress-tested. Excess leverage is being purged. Weak structures are failing. Strong ones are being priced without speculation.
History suggests that this is not where the story ends. It is where it slows down, resets, and quietly prepares for its next chapter.
The storm will pass. The question is not whether crypto survives.
It is who is still positioned when confidence returns.

Top 6 ZachXBT Revelations That Shocked The World
AI Agent Payments Explained: Circle Nanopayments and the x402 Protocol
Top 7 Projects in the World Liberty Financial (WLFI) Portfolio
Where Crypto Actually Makes Money in 2026?
Top 6 ZachXBT Revelations That Shocked The World
AI Agent Payments Explained: Circle Nanopayments and the x402 Protocol
Top 7 Projects in the World Liberty Financial (WLFI) Portfolio
Where Crypto Actually Makes Money in 2026?